Archive for the ‘Evidence Based Medicine’ Category

As the nutrition world implodes, there are a lot of accusations about ulterior motives and personal gain. (A little odd, that in this period of unbelievable greed — CEO’s ripping off public companies for hundreds of millions of dollars, congress trying to give tax breaks to billionaires — book authors are upbraided for trying to make money). So let me declare that I am not embarrassed to be an author for the money — although the profits from my book do go to research, it is my own research and the research of my colleagues. So beyond general excellence (not yet reviewed by David Katz), I think “World Turned Upside Down” does give you some scientific information about red meat and cancer that you can’t get from the WHO report on the subject.

The WHO report has not yet released the evidence to support their claim that red meat will give you cancer but it is worth going back to one of the previous attacks.  Chapters 18 and 19 discussed a paper by Sinha et al, entitled “Meat Intake and Mortality.”    The Abstract says “Conclusion: Red and processed meat intakes were associated with modest increases in total mortality, cancer mortality, and cardiovascular disease mortality,” I had previously written a blogpost about the study indicating how weak the association was. In that post, I had used the data on men but when I incorporated the information into the book, I went back to Sinha’s paper and analyzed the original data. For some reason, I also checked the data on women. That turned out to be pretty surprising:

Sinha_Table3_Chapter18_Apr22

I described on Page 286: “The population was again broken up into five groups or quintiles. The lower numbered quintiles are for the lowest consumption of red meat. Looking at all cause mortality, there were 5,314 deaths [in lowest quintile] and when you go up to quintile 05, highest red meat consumption, there are 3,752 deaths. What? The more red meat, the lower the death rate? Isn’t that the opposite of the conclusion of the paper? And the next line has [calculated] relative risk which now goes the other way: higher risk with higher meat consumption. What’s going on? As near as one can guess, “correcting” for the confounders changed the direction….” They do not show most of the data or calculations but I take this to be equivalent to a multivariate analysis, that is, red meat + other things gives you risk. If they had broken up the population by quintiles of smoking, you would see that that was the real contributor. That’s how I interpreted it but, in any case, their conclusion is about meat and it is opposite to what the data say.

So how much do you gain from eating red meat? “A useful way to look at this data is from the standpoint of conditional probability. We ask: what is the probability of dying in this experiment if you are a big meat‑eater? The answer is simply the number of people who both died during the experiment and were big meat‑eaters …. = 0.0839 or about 8%. If you are not a big meat‑eater, your risk is …. = 0.109 or about 11%.” Absolute gain is only 3 %. But that’s good enough for me.

Me, at Jubilat, the Polish butcher in the neighborhood: “The Boczak Wedzony (smoked bacon). I’ll take the whole piece.”

Wedzony_Nov_8

Boczak Wedzony from Jubilat Provisions

Rashmi Sinha is a Senior Investigator and Deputy Branch Chief and Senior at the NIH. She is a member of the WHO panel, the one who says red meat will give you cancer (although they don’t say “if you have the right confounders.”)

So, buy my book: AmazonAlibris, or

Direct:  Personalized, autographed copy $ 20.00 free shipping USA only.  Use coupon code: SEPT16


…what metaphysics is to physics. The old joke came to mind when a reporter asked me yesterday to comment on a paper published in the BMJ. “Intake of saturated and trans unsaturated fatty acids and risk of all cause mortality, cardiovascular disease, and type 2 diabetes: systematic review and meta-analysis of observational studies” by de Souza, et al.

Now the title ““Intake of saturated and trans unsaturated fatty acids…” tells you right off that this is not good news; lumping together saturated fat and trans-fat represents a clear  indication of bias. A stand-by of Atkins-bashers, it is a way of vilifying saturated fat when the data won’t fit.  In the study that the reporter asked about, the BMJ provided a summary:

“There was no association between saturated fats and health outcomes in studies where saturated fat generally replaced refined carbohydrates, but there was a positive association between total trans fatty acids and health outcomes Dietary guidelines for saturated and trans fatty acids must carefully consider the effect of replacement nutrients.”

“But?” The two statements are not really connected. In any case the message is clear: saturated fat is Ok. Trans-fat is not Ok. So, we have to be concerned about both  saturated fat and trans-fat. Sad.

And “systematic” means the system that the author wants to use. This usually means “we searched the database of…” and then a meta-analysis. Explained by the overly optimistic “What is …?” series:

Meta-anal_WhatIs

The jarring notes are “precise estimate” in combination with “combining…independent studies.” In practice, you usually only repeat an experiment exactly if you suspect that something was wrong with the original study or if the result is sufficiently outside expected values that you want to check it. Such an examination sensibly involves a fine-grained analysis of the experimental details. The idea underlying the meta-analysis, however, usually unstated, is that the larger the number of subjects in a study, the more compelling the conclusion. One might make the argument, instead, that if you have two or more studies which are imperfect, combining them is likely to lead to greater uncertainty and more error, not less.  I am one who would make such an argument. So where did meta-analysis come from and what, if anything, is it good for?

I am trained in enzyme and protein chemistry but I have worked in a number of different  fields including invertebrate animal behavior. I never heard of meta-analysis until very recently, that is, until I started doing research in nutrition. In fact, in 1970 there weren’t any meta-analyses, at least not with that phrase in the title, or at least not as determined by my systematic PubMed search. By 1990, there were about a 100 and by 2014, there were close to 10, 000 (Figure 1).

Meta-anal_Year_Mar9Figure 1. Logarithm of the number of papers in PubMed search with the title containing “meta-analysis” vs. Year of publication

This exponential growth suggests that the technique grew by reproducing itself. It suggests, in fact, that its origins are in spontaneous generation. In other words, it is popular because it is popular. (It does have obvious advantages; you don’t have to do any experiments). But does it give any useful information?

Meta-analysis

If you have a study that is under-powered, that is, if you only have a small number of subjects, and you find a degree of variability in the outcome, then combining the results from your experiment with another small study may point you to a consistent pattern. As such, it is a last-ditch, Hail-Mary kind of method. Applying it to large studies that have statistically meaningful results, however, doesn’t make sense, because:

  1. If all of the studies go in the same direction, you are unlikely to learn anything from combining them. In fact, if you come out with a value for the output that is different from the value from the individual studies, in science, you are usually required to explain why your analysis improved things. Just saying it is a larger n won’t cut it, especially if it is my study that you are trying to improve on.
  2. In the special case where all the studies show no effect and you come up with a number that is statistically significant, you are, in essence saying that many wrongs can make a right as described in a previous blog post on abuse of meta-analyses.  In that post, I re-iterated the statistical rule that if the 95% CI bar crosses the line for hazard ratio = 1.0 then this is taken as an indication that there is no significant difference between the two conditions that are being compared. The example that I gave was the meta-analysis by Jakobsen, et al. on the effects of SFAs or a replacement on CVD outcomes (Figure 2). Amazingly, in the list of 15 different studies that she used, all but one cross the hazard ratio = 1.0 line. In other words, only one study found that keeping SFAs in the diet provides a lower risk than replacement with carbohydrate. For all the others there was no significant difference.  The question is why an analysis was done at all.  What could we hope to find? How could 15 studies that show nothing add up to a new piece of information? Most amazing is that some of the studies are more than 20 years old. How could these have had so little impact on our opinion of saturated fat?  Why did we keep believing that it was bad?

SFA_Jakobsen_Sub_AJCN-2_2009

Figure 2. Hazard ratios and 95% confidence intervals for coronary events and deaths in the different studies in a meta-analysis from Jakobsen, et al.Major types of dietary fat and risk of coronary heart disease: a pooled analysis of 11 cohort studies. Am J Clin Nutr 2009, 89(5):1425-1432.

3. Finally, suppose that you are doing a meta-analysis on several studies and that they have very different outcomes, showing statistically significant associations in different directions. For example, if some studies showed substituting saturated fat for carbohydrate increased risk while some showed that it decreased risk. What will you gain by averaging them? I don’t know about you but it doesn’t sound good to me. It makes me think of the old story of the emerging nation that was planning to build a railroad and didn’t know whether to use a gauge that matched the country to the north or the gauge of the country to the south. The parliament voted to use a gauge that was the average of the two.

In  The World Turned Upside Down. The Second Low-Carbohydrate Revolution, I added my voice to the critiques of the low-fat hypothesis and the sorry state of nutritional science. I also provided specific strategies on how to analyze reports in the literature to find out whether the main point of the paper is valid or not. The deconstructions of traditional nutrition, the “also bought” of my book on the Amazon page, are numerous and continuing to proliferate as more and more people become aware of how bad things are. To me, the “surprise” in Nina Teicholz’s “Big Fat Surprise” is that, after all the previous exposés and my own research, there were deceptive practices and poor science that even I didn’t know about.

Even establishment voices are beginning to perceive how bad things are. So, with all these smoking guns why doesn’t anybody do anything? Why doesn’t somebody blow the whistle on them? It’s not like we are dealing with military intelligence.  What are they going to do? Not fund my grant? Not publish my paper? Ha.

Whistleblowing

“When you go to work today, imagine having a tape recorder attached to your body, a second one in your briefcase, and a third one in a special notebook, knowing that you will be secretly taping your supervisors, coworkers, and in some cases, your friends.” These are the opening lines of Mark Whitacre’s remarkable confession/essay/exposé (later a movie with Matt Damon) describing his blowing the whistle on Archer Daniels Midland (ADM) one of the largest food companies in the world; their motto at the time “ADM. Supermarket to the world.”

informant_lMatt Damon in The Informant!

It turned out that ADM had been colluding with its competitors to fix prices, in particular on the amino acid, lysine. Whitacre’s story is fascinating in detail.  Although relatively young, he was high up in the company, a division manager (“I lived in a huge home, which had an eight car garage filled with eight cars, and indoor horse-riding stables for my children”). He travelled around the world to big corporate meetings. At some point, encouraged by his wife whose ethical standards were quite a bit higher than his own, he became an FBI informant. Accompanying him in his business trips was a green lamp, housing a video feed. ”It is a good thing that all of the co- conspirators were men. A woman would have immediately noticed that this green lamp did not match the five star décor of some of the finest hotels, such as the Four Seasons in Chicago.” Ultimately, the lysine trial resulted in fines and three-year prison sentences for three of the executives of ADM as well as criminal fine for foreign companies worth $105 million, a record at the time. At the trial, things really went down-hill for the company when Whitacre produced a tape recording of the President of ADM telling executives that the company’s competitors were their friends and their customers were the enemy. Wits at the time suggested a new motto “ADM. Super mark-up to the world.” In the end, in a remarkable twist in the story, Whitacre’s whistle-blowing was compromised by the fact that he was on the take himself.

“I concluded that I would steal my own severance pay, and decided upon $9.5 million, which amounted to several years of my total compensation. …And I also considered what would happen if ADM learned of this theft. If they accused me, I thought that I had the perfect answer. How can you prosecute me for stealing $9.5 million when you are stealing hundreds of millions of dollars each year in the price fixing scheme? …. I decided to submit several bogus invoices to ADM, until I accumulated $9.5 million, which was meant to be my family’s financial security when I would be fired at a future date for being a whistleblower.”

As it turned out, a number of food and beverage companies, who had won hundreds of millions in settlements against ADM  were the ones who actually provided financial security for his family while Mark Whitacre spent nine years in prison.

Whistle blowing and imperial deshabillement

If it is not hidden, is it whistle-blowing? Did the kid “blow the whistle on the emperor’s new clothes?” If it is right out in the open, what is the scandal?  Well, there is open and there is open. Leaving out information may be a sign of a cover-up. I described, in my book, the case of the paper by Foster, et al., the conclusion of which was that “neither dietary fat nor carbohydrate intake influenced weight loss.”  I admitted, in the book, that:

“I had not read Foster’s paper very carefully before making the pronouncement that it was not very good. I was upbraided by a student for such a rush to judgment. I explained that that is what I do for a living. I explained that I usually don’t have to spend a lot of time on a paper to see the general drift…. but I was probably not totally convincing. So I read the paper, which is quite a bit longer than usual. The main thing that I was looking for was information on the nutrients that were actually consumed since it was their lack of effect that was the main point of the paper.…

In a diet experiment, the food consumed should be right up front but I couldn’t find it at all…. The data weren’t there. I was going to write to the authors when I found out…that this paper had been covered in a story in the Los Angeles Times. As reported by Bob Kaplan: ‘Of the 307 participants enrolled in the study, not one had their food intake recorded or analyzed by investigators. The authors did not monitor, chronicle or report any of the subjects’ diets. No meals were administered by the authors; no meals were eaten in front of investigators. There were no self‑reports, no questionnaires. The lead authors, Gary Foster and James Hill, explained in separate e-mails that self‑reported data are unreliable and therefore they didn’t collect or analyze any.’

I confess to feeling a bit shocked. I don’t like getting scientific information from the LA Times.  How can you say “neither dietary fat nor carbohydrate intake influenced weight loss” if you haven’t measured fat or carbohydrate? …. in fact, the whole nutrition field runs on self‑reported data. Is all that stuff from the Harvard School of Public Health, all those epidemiology studies that rely on food records, to be chucked out?”

So was this a breach of research integrity? It might be considered simply an error of omission. If you didn’t measure food consumed, you might think that you don’t necessarily have to put it in the methods. Was it just dumb not to realize that if you write a study of a diet comparison, you can’t leave out what people ate or at least admit that you didn’t measure what they ate. So can you blow the whistle on them for not telling the whole truth?  The authors were all well-known researchers, if party-liners.

The Office of Research Integrity is set up to police serious infractions in federally funded grants but it usually has to be clear cut and, sometimes, there is a whistle-blower. The Baltimore case is one of the better known if somewhat embarrassing cases for the agency — there was nothing to the whistle-blower’s allegations. In any case, there is a big gray area. If you falsify your data on a government research grant, you can go to jail.  If you make a dumb interpretation, however, if you say the data mean X when they show not-X, well, research is about unknowns, and you may have slipped up. Even Einstein admitted to the need to offer “sacrifices at the altar of Stupidity.” The NIH is supposed to not fund stuff like that. Editors and reviewers are supposed to see through the omission. What if they fell down on the job too? What if you have a field like nutrition where the NIH study sections are on the same wavelength as the researchers. There is, however, the question of the total impact. A lot of stuff is never cited and never does any harm. I enquired with the ORI, in a general way, about Foster’s paper. They said that if it is widely quoted, it could be an infraction. It has, in fact, been cited as evidence against low-carb diets. So am I going to be a whistle-blower? I don’t think so.

The problem is that only an insider can blow the whistle and although cooperation and collegiality remain very weak in the nutrition field, it is still our own nest and whistle-blowing makes everybody look bad. The “long blue line” does not form because the police think that corruption is okay. The problem is not just that there can be retribution, as in Serpico, but that it makes everybody look bad. It is simply that it reflects poorly on the whole police force. And while it is probable that, as Mark Whitacre said, “almost all of their 30,000 employees went to work each day doing the right thing morally and ethically,” the statement that “ADM was not a bad company” does not ring true. If we call attention to what is tolerated in medical nutrition, we are all looking like fools. And, of course, Foster’s paper is one of the more egregious but there is a lot of competition for worst. And it reflects badly on all of us in the field. “Is that what you do when you go to work?”

The parable of the big fish

I received an email from a physician in England. He has had consistently good results with low-carbohydrate diets.

“There is never a day when I don’t see the deleterious effects of too many carbs on those with the metabolic syndrome. And yet most doctors carry on as if it doesn’t exist !! …

Only yesterday I saw a man I have known for over 15 years. His GGT [gamma-glutamyl transferase; marker for liver disease] had always been about double normal. Embarrassingly I had assumed that he was a drinker, despite repeated denial, thinking his big belly was evidence!  He chose low carb on March 2013 and never looked back. Liver function normal now and an easy 7 Kg weight loss.”

He said that the information had been used in the production of the ABC Catalyst TV documentary from Australia, but:

“I am a very, very small fish! As smaller fish we GPs specialise in getting ideas across to ordinary folk. The Internet is democratising medicine faster than some big fish realise. I wrote my practical diabetes piece partly for the educated general public and insisted on open access.

Big fish will scoff at my small numbers (70) and lack of double blindness anyway.”

I assured him that he was making an impact, that n = 70 was fine and not to worry about the big fish. I related a story told to me by one of my colleagues in graduate school: he had gone fishing in the Gulf of Mexico and they had caught a very big fish (I no longer remember the kind) which was thrashing around on the deck and they could not contain it. There happened to be a rifle on board and somebody shot the fish. The bullet went through the bottom of the boat which sank.

“…789 deaths were reported in Doll and Hill’s original cohort. Thirty-six of these were attributed to lung cancer. When these lung cancer deaths were counted in smokers versus non-smokers, the correlation virtually sprang out: all thirty-six of the deaths had occurred in smokers. The difference between the two groups was so significant that Doll and Hill did not even need to apply complex statistical metrics to discern it. The trial designed to bring the most rigorous statistical analysis to the cause of lung cancer barely required elementary mathematics to prove his point.”

Siddhartha Mukherjee —The Emperor of All Maladies.

 Scientists don’t like philosophy of science. It is not just that pompous phrases like hypothetico-deductive systems are such a turn-off but that we rarely recognize it as what we actually do. In the end, there is no definition of science and it is hard to generalize about actual scientific behavior. It’s a human activity and precisely because it puts a premium on creativity, it defies categorization. As the physicist Steven Weinberg put it, echoing Justice Stewart on pornography:

“There is no logical formula that establishes a sharp dividing line between a beautiful explanatory theory and a mere list of data, but we know the difference when we see it — we demand a simplicity and rigidity in our principles before we are willing to take them seriously [1].”

A frequently stated principle is that “observational studies only generate hypotheses.” The related idea that “association does not imply causality” is also common, usually cited by those authors who want you to believe that the association that they found does imply causality. These ideas are not right or, at least, they insufficiently recognize that scientific experiments are not so easily wedged into categories like “observational studies.”  The principles are also invoked by bloggers and critics to discredit the continuing stream of observational studies that make an association between their favorite targets, eggs, red meat, sugar-sweetened soda and a metabolic disease or cancer. In most cases, the studies are getting what they deserve but the bills of indictment are not quite right.  It is usually not simply that they are observational studies but rather that they are bad observational studies and, in any case, the associations are so weak that it is reasonable to say that they are an argument for a lack of causality. On the assumption that good experimental practice and interpretation can be even roughly defined, let me offer principles that I think are a better representation, insofar as we can make any generalization, of what actually goes on in science:

 Observations generate hypotheses. 

Observational studies test hypotheses.

Associations do not necessarily imply causality.

In some sense, all science is associations. 

Only mathematics is axiomatic.

 If you notice that kids who eat a lot of candy seem to be fat, or even if you notice that candy makes you yourself fat, that is an observation. From this observation, you might come up with the hypothesis that sugar causes obesity. A test of your hypothesis would be to see if there is an association between sugar consumption and incidence of obesity. There are various ways — the simplest epidemiologic approach is simply to compare the history of the eating behavior of individuals (insofar as you can get it) with how fat they are. When you do this comparison you are testing your hypothesis. There are an infinite number of things that you could have measured as an independent variable, meat, TV hours, distance from the French bakery but you have a hypothesis that it was candy. Mike Eades described falling asleep as a child by trying to think of everything in the world. You just can’t test them all. As Einstein put it “your theory determines the measurement you make.”

Associations predict causality. Hypotheses generate observational studies, not the other way around.

In fact, association can be strong evidence for causation and frequently provide support for, if not absolute proof, of the idea to be tested. A correct statement is that association does not necessarily imply causation. In some sense, all science is observation and association. Even thermodynamics, that most mathematical and absolute of sciences, rests on observation. As soon as somebody observes two systems in thermal equilibrium with a third but not with each other (zeroth law), the jig is up. When somebody builds a perpetual motion machine, that’s it. It’s all over.

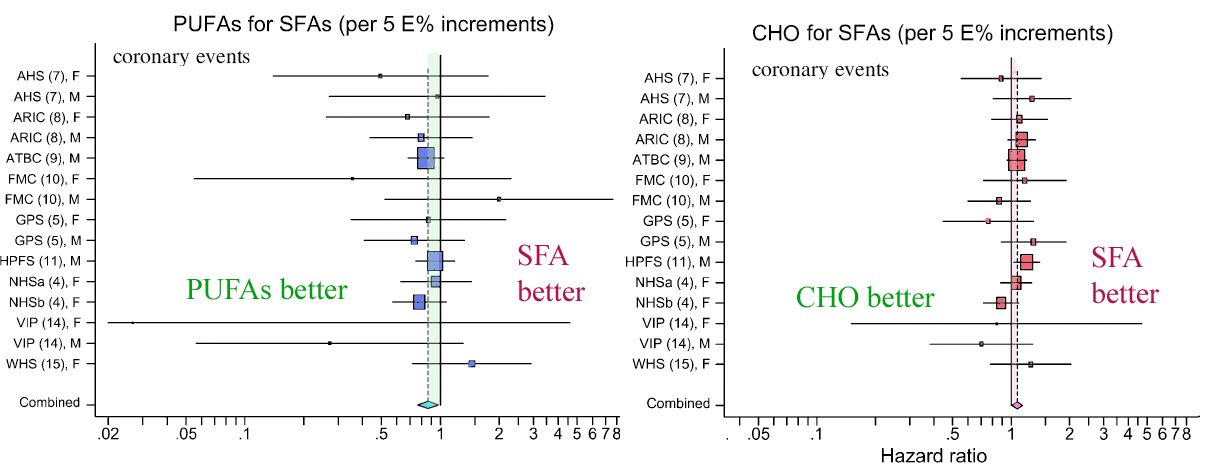
Biological mechanisms, or perhaps any scientific theory, are never proved. By analogy with a court of law, you cannot be found innocent, only not guilty. That is why excluding a theory is stronger than showing consistency. The grand epidemiological study of macronutrient intake vs diabetes and obesity shows that increasing carbohydrate is associated with increased calories even under conditions where fruits and vegetables also went up and fat, if anything went down. It is an observational study but it is strong because it gives support to a lack of causal effect of increased carbohydrate and decreased fat on outcome. The failure of total or saturated fat to have any benefit is the kicker here. It is now clear that prospective experiments have, in the past, and will continue to show, the same negative outcome. Of course, in a court of law, if you are found not guilty of child abuse, people may still not let you move into their neighborhood. It is that saturated fat should never have been indicted in the first place.

An association will tell you about causality 1) if the association is strong and 2) if there is a plausible underlying mechanism and 3) if there is no more plausible explanation — for example, countries with a lot of TV sets have modern life styles that may predispose to cardiovascular disease; TV does not cause CVD.

Re-inventing the wheel. Bradford Hill and the history of epidemiology.

Everything written above is true enough or, at least, it seemed that way to me. I thought of it as an obvious description of what everybody knows. The change to saying that “association does not necessarily imply causation” is important but not that big a deal. It is common sense or logic and I had made it into a short list of principles. It was a blogpost of reasonable length. I described it to my colleague Gene Fine. His response was “aren’t you re-inventing the wheel?” Bradford Hill, he explained, pretty much the inventor of modern epidemiology, had already established these and a couple of other principles. Gene cited The Emperor of All Maladies, an outstanding book on the history of cancer.  I had read The Emperor of All Maladies on his recommendation and I remembered Bradford Hill and the description of the evolution of the ideas of epidemiology, population studies and random controlled trials. I also had a vague memory, of reading the story in James LeFanu’s The Rise and Fall of Modern Medicine, another captivating history of medicine. However, I had not really absorbed these as principles. Perhaps we’re just used to it, but saying that an association implies causality only if it is a strong association is not exactly a scientific breakthrough. It seems an obvious thing that you might say over coffee or in response to somebody’s blog. It all reminded me of learning, in grade school, that the Earl of Sandwich had invented the sandwich and thinking “this is an invention?”  Woody Allen thought the same thing and wrote the history of the sandwich and the Earl’s early failures — “In 1741, he places bread on bread with turkey on top. This fails. In 1745, he exhibits bread with turkey on either side. Everyone rejects this except David Hume.”

At any moment in history our background knowledge — and accepted methodology —  may be limited. Some problems seem to have simple solutions. But simple ideas are not always accepted. The concept of the random controlled trial (RCT), obvious to us now, was hard won and, proving that any particular environmental factor — diet, smoking, pollution or toxic chemicals was the cause of a disease and that, by reducing that factor, the disease could be prevented, turned out to be a very hard sell, especially to physicians whose view of disease may have been strongly colored by the idea of an infective agent.

Hill_CausationThe Rise and Fall of Modern Medicine describes Bradford Hill’s two demonstrations that streptomycin in combination with PAS (para-aminosalicylic acid) could cure tuberculosis and that tobacco causes lung cancer as one of the Ten Definitive Moments in the history of modern medicine (others shown in the textbox). Hill was Professor of Medical Statistics at the London School of Hygiene and Tropical Medicine but was not formally trained in statistics and, like many of us, thought of proper statistics as common sense. An early near fatal case of tuberculosis also prevented formal medical education. His first monumental accomplishment was, ironically, to demonstrate how tuberculosis could be cured with the combination of streptomycin and PAS.  In 1941, Hill and co-worker Richard Doll undertook a systematic investigation of the risk factors for lung cancer. His eventual success was accompanied by a description of the principles that allow you to say when association can be taken as causation.

 Ten Definitive Moments from Rise and Fall of Modern Medicine.

1941: Penicillin

1949: Cortisone

1950: streptomycin, smoking and Sir Austin Bradford Hill

1952: chlorpromazine and the revolution in psychiatry

1955: open-heart surgery – the last frontier

1963: transplanting kidneys

1964: the triumph of prevention – the case of strokes

1971: curing childhood cancer

1978: the first ‘Test-Tube’ baby

1984: Helicobacter – the cause of peptic ulcer

Wiki says: “in 1965, built  upon the work of Hume and Popper, Hill suggested several aspects of causality in medicine and biology…” but his approach was not formal — he never referred to his principles as criteria — he recognized them as common sense behavior and his 1965 presentation to the Royal Society of Medicine, is a remarkably sober, intelligent document. Although described as an example of an article that, as here, has been read more often in quotations and paraphrases, it is worth reading the original even today.

Note: “Austin Bradford Hill’s surname was Hill and he always used the name Hill, AB in publications. However, he is often referred to as Bradford Hill. To add to the confusion, his friends called him Tony.” (This comment is from Wikipedia, not Woody Allen).

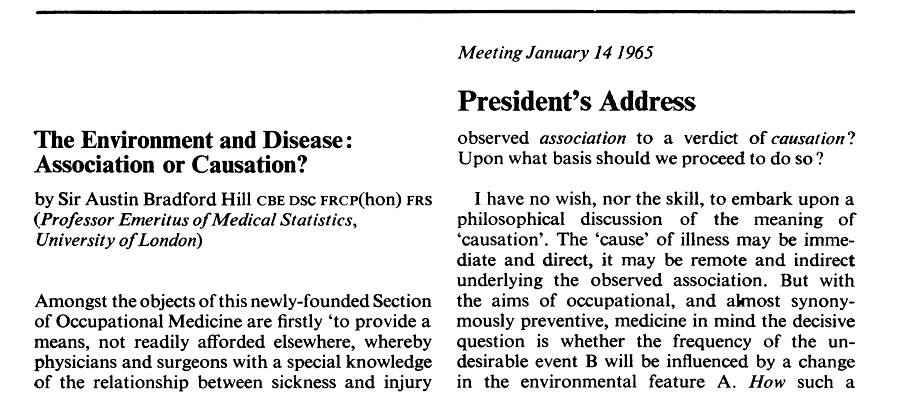
The President’s Address

Bradford Hill’s description of the factors that might make you think an association implied causality:

Hill_Environment1965

1. Strength. “First upon my list I would put the strength of the association.” This, of course, is exactly what is missing in the continued epidemiological scare stories. Hill describes

“….prospective inquiries into smoking have shown that the death rate from cancer of the lung in cigarette smokers is nine to ten times the rate in non-smokers and the rate in heavy cigarette smokers is twenty to thirty times as great.”

But further:

“On the other hand the death rate from coronary thrombosis in smokers is no more than twice, possibly less, the death rate in nonsmokers. Though there is good evidence to support causation it is surely much easier in this case to think of some features of life that may go hand-in-hand with smoking – features that might conceivably be the real underlying cause or, at the least, an important contributor, whether it be lack of exercise, nature of diet or other factors.”

Doubts about an odds ratio of two or less. That’s where you really have to wonder about causality. The progression of epidemiologic studies that tell you red meat, HFCS, etc. will cause diabetes, prostatic cancer, or whatever, these rarely hit an odds ratio of 2.  While the published studies may contain disclaimers of the type in Hill’s paper, the PR department of the university where the work is done, and hence the public media, show no such hesitation and will quickly attribute causality to the study as if the odds ratio were 10 instead of 1.2.

2. Consistency: Hill listed the repetition of the results in other studies under different circumstances as a criterion for considering how much an association implied causality. Not mentioned but of great importance, is that this test cannot be made independent of the first criterion. Consistently weak associations do not generally add up to a strong association. If there is a single practice in modern medicine that is completely out of whack with respect to careful consideration of causality, it is the meta-analysis where studies with no strength at all are averaged so as to create a conclusion that is stronger than any of its components.

3. Specificity. Hill was circumspect on this point, recognizing that we should have an open mind on what causes what. On specificity of cancer and cigarettes, Hill noted that the two sites in which he showed a cause and effect relationship were the lungs and the nose.

4. Temporality: Obviously, we expect the cause to precede the effect or, as some wit put it “which got laid first, the chicken or the egg.”  Hill recognized that it was not so clear for diseases that developed slowly. “Does a particular diet lead to disease or do the early stages of the disease lead to those peculiar dietetic habits?” Of current interest are the epidemiologic studies that show a correlation between diet soda and obesity which are quick to see a causal link but, naturally, one should ask “Who drinks diet soda?”

5. Biological gradient:  the association should show a dose response curve. In the case of cigarettes, the death rate from cancer of the lung increases linearly with the number of cigarettes smoked. A subset of the first principle, that the association should be strong, is that the dose-response curve should have a meaningful slope and, I would add, the numbers should be big.

6. Plausibilityy: On the one hand, this seems critical — the association of egg consumption with diabetes is obviously foolish — but the hypothesis to be tested may have come from an intuition that is far from evident. Hill said, “What is biologically plausible depends upon the biological knowledge of the day.”

7. Coherence: “data should not seriously conflict with the generally known facts of the natural history and biology of the disease”

8. Experiment: It was another age. It is hard to believe that it was in my lifetime. “Occasionally it is possible to appeal to experimental, or semi-experimental, evidence. For example, because of an observed association some preventive action is taken. Does it in fact prevent?” The inventor of the random controlled trial would be amazed how many of these are done, how many fail to prevent. And, most of all, he would have been astounded that it doesn’t seem to matter. However, the progression of failures, from Framingham to the Women’s Health Initiative, the lack of association between low fat, low saturated fat and cardiovascular disease, is strong evidence for the absence of causation.

9. Analogy: “In some circumstances it would be fair to judge by analogy. With the effects of thalidomide and rubella before us we would surely be ready to accept slighter but similar evidence with another drug or another viral disease in pregnancy.”

Hill’s final word on what has come to be known as his criteria for deciding about causation:

“Here then are nine different viewpoints from all of which we should study association before we cry causation. What I do not believe — and this has been suggested — is that we can usefully lay down some hard-and-fast rules of evidence that must be obeyed before we accept cause and effect. None of my nine viewpoints can bring indisputable evidence for or against the cause-and-effect hypothesis and none can be required as a sine qua non. What they can do, with greater or less strength, is to help us to make up our minds on the fundamental question – is there any other way of explaining the set of facts before us, is there any other answer equally, or more, likely than cause and effect?” This may be the first critique of the still-to-be-invented Evidence-based Medicine.

Nutritional Epidemiology.

The decision to say that an observational study implies causation is equivalent to an assertion that the results are meaningful, that it is not a random association at all, that it is scientifically sound. Critics of epidemiological studies have relied on their own perceptions and appeal to common sense and when I started this blogpost, I was one of them, and I had not appreciated the importance of Bradford Hill’s principles. The Emperor of All Maladies described Hill’s strategies for dealing with association and causation “which have remained in use by epidemiologists to date.”  But have they? The principles are in the texts. Epidemiology, Biostatistics, and Preventive Medicine has a chapter called “The study of causation in Epidemiologic Investigation and Research” from which the dose-response curve was modified. Are these principles being followed? Previous posts in this blog and others have have voiced criticisms of epidemiology as it’s currently practiced in nutrition but we were lacking a meaningful reference point. Looking back now, what we see is a large number of research groups doing epidemiology in violation of most of Hill’s criteria.

The red meat scare of 2011 was Pan, et al and I described in a previous post, the remarkable blog from Harvard . Their blog explained that the paper was unnecessarily scary because it had described things in terms of “relative risks, comparing death rates in the group eating the least meat with those eating the most. The absolute risks… sometimes help tell the story a bit more clearly. These numbers are somewhat less scary.”  I felt it was appropriate to ask “Why does Dr. Pan not want to tell the story as clearly as possible?  Isn’t that what you’re supposed to do in science? Why would you want to make it scary?” It was, of course, a rhetorical question.

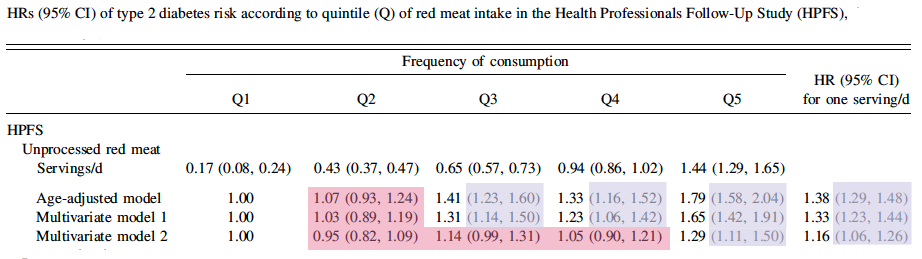
Looking at Pan, et al. in light of Bradford Hill, we can examine some of their data. Figure 2 from their paper shows the risk of diabetes as a function of red meat in the diet. The variable reported is the hazard ratio which can be considered roughly the same as the odds ratio, that is, relative odds of getting diabetes. I have indicated, in pink, those values that are not statistically significant and I grayed out the confidence interval to make it easy to see that these do not even hit the level of 2 that Bradford Hill saw as some kind of cut-off.

TheBlog_Cause_Pan_Fig2_

The hazard ratios for processed meat are somewhat higher but still less than 2. This is weak data and violates the first and most important of Hill’s criteria. As you go from quartile 2 to 3, there is an increase in risk, but at Q4, the risk goes down and then back up at Q5, in distinction to principle 5 which suggests the importance of dose-response curves. But, stepping back and asking what the whole idea is, asking why you would think that meat has a major — and isolatable role separate from everything else — in a disease of carbohydrate intolerance, you see that this is not rational, this is not science. And Pan is not making random observations. This is a test of the hypothesis that red meat causes diabetes. Most of us would say that it didn’t make any sense to test such a hypothesis but the results do not support the hypothesis.

What is science?

Science is a human activity and what we don’t like about philosophy of science is that it is about the structure and formalism of science rather than what scientists really do and so there aren’t even any real definitions. One description that I like, from a colleague at the NIH: “What you do in science, is you make a hypothesis and then you try to shoot yourself down.” One of the more interesting sidelights on the work of Hill and Doll, as described in Emperor, was that during breaks from the taxing work of analyzing the questionnaires that provided the background on smoking, Doll himself would step out for a smoke. Doll believed that cigarettes were unlikely to be a cause — he favored tar from paved highways as the causative agent — but as the data came in, “in the middle of the survey, sufficiently alarmed, he gave up smoking.” In science, you try to shoot yourself down and, in the end, you go with the data.

The King in Hamlet says “you cannot speak of reason to the Dane and lose your voice” and most Americans do feel good about the Danes. We hold to the stereotype that they are friendly folk with a dry sense of humor like Victor Borge.  That is why Reuben and Rose Mattus, the Polish-Jewish immigrant ice-cream makers from the Bronx who tried to find an angle that would allow them to compete with Sealtest® and other big guns, picked Häagen-Dazs® as the name for their up-scale ice cream, even including a map of Denmark on the early packaging. (Never mind that there is no Scandinavian language that has the odd-ball collection of foreign-looking spelling; Danish does not have an umlaut and I don’t think any Indo-European language has the combination “zs;” there is Zsa Zsa Gabor, of course, but Hungarian is a Uralic language related only to languages that you never heard of).

Jakob Axel Nielsen

The original post here held that the Mattuses would have been very surprised to see that products like their high-butterfat ice cream are now a target of the Danish government which instituted a tax on foods containing saturated fat on October 1 of 2011. The tax, I am happy to say has since been repealed.  In a brilliant turn-around that gives a great insight into the mind of the tax man, the Times reported that ” the tax raised $216 million in new revenue. To offset the loss of that money, the Legislature plans a small increase in income taxes and the elimination of some deductions.” Get it? They are going to increase taxes to cover the money that they hoped to have, never mind, that the intention was to stop people from buying the stuff that would bring in the revenue.

The original idea for collecting taxes on a number of items including “sugar, fat and tobacco,” came from  Jakob Axel Nielsen (right), then Sundhedsminister.  A graduate of the law school at Aarhus, Nielsen is reputed to know even more about science than Hizzona’ Michael Bloomberg.  The LA Times points out, however, that “for those who may be tempted to call for Nielsen’s job, please note that he stepped down…last year.”

One of the things that is surprising about all this is that, in  2009, a combined Danish and American research group whose senior author was Dr. Marianne Jakobsen of Copenhagen University Hospital published a paper showing that there was virtually no effect of dietary saturated fatty acids (SFAs) on cardiovascular disease.  The study was a meta-analysis which means a re-evaluation of many previous studies. The authors concluded that the results “suggest that replacing SFA intake with PUFA (polyunsaturated fatty acid) intake rather than MUFA (monounsaturated fatty acids) or carbohydrate intake prevents CHD (coronary heart disease) over a wide range of intakes.”

As in many nutritional papers, it is worthwhile to actually look at the data.  The figure below, from Jakobsen’s paper shows the results from several studies in which the effect of substituting 5 % of energy from SFA with either carbohydrate (CHO) or PUFA or MUFA (not shown here) was measured.  The outcome variable is the hazard ratio for incidence of coronary events (heart attack, sudden death).  You can think of the hazard ratio as similar to an odds ratio which is what it sounds like: the comparative odds of different possible outcomes. The basic idea is that if 10 people in a group of 100 have a heart attack with saturated fat in their diet, the odds = 10 out of 100 or 1/10.  If you now replace 5 % of energy with PUFAs for a different group of 100 and find only 8 people have an event, then the odds for the second group is 8/100 and the odds ratio is 0.8 (8/100 divided by 10/100).  If the odds ratio were 1.0, then there would be no benefit either way, no difference if you keep SFAs or replace.  So in the first figure below, most of the points are to the left of the point 1.0, suggesting that PUFA is better than SFA but the figure on the right suggests that SFA is better than CHO.  But is this real?

You probably noticed that you would have the same odds ratio if the sample sizes were 1000.  In other words, a ratio gives relative values and obscures some information. If there were a large number of people and the real numbers were actually 8 and 10, you wouldn’t put much stock in the hazard ratio; decreasing your chances of a low probability event is not a big deal; you double your chances of winning the lottery by buying two tickets.  In fact, whereas heart disease is a big killer, if you study a thousand people for 5 years there will be only a small number of coronary events. I discussed this in a previous post, but giving Jakobsen the benefit of the doubt that there were really differences on outcomes, we need to know whether the hazard ratios are really reliable.  In this case, Jakobsen showed the variability in the results with “95% confidence intervals,” which are represented by the horizontal bars in the figure.

The 95% confidence interval (95% CI) is a measure of the spread of values around the average. It tells you how reliable the data is. Technically, the term means that if you calculate the size of the interval over and over, 95% of the time the interval will contain the true value. Although not technically precise, you could think of it as meaning that there is a 95% chance of the interval containing the true value.

There is one important point here. It is a statistical rule that if the 95% CI bar crosses the line for hazard ratio = 1.0 then this is taken as indiction that there is no significant difference between the two conditions, in this case, SFAs or a replacement.  Looking at the figure from Jakobsen, we are struck by the fact that, in the list of 15 different studies for two replacements, all but one cross the hazard ratio = 1.0 line; one study found that keeping SFAs in the diet provides a lower risk than replacement with carbohydrate. For all the others it was a wash.  At this point, one has to ask why a combined value was calculated.  How could 15 studies that show nothing add up to a new piece of information. Who says two wrongs, or even 15, can’t make a right?  The remarkable thing is that some of the studies in this meta-analysis are more than 20 years old. How could these have had so little impact?  Why did we keep believing that saturated fat was bad?

Taxing Saturated Fat.

Now the main thing that taxes do is bring in money.   That’s why it is not a good idea to tie it to a health strategy unless you are really sure (as in the case of cigarettes). For one thing, there is something contradictory (or pessimistic) about trying to raise money from a behavior that you want people to stop doing.   In any case, given that during the epidemic of obesity and diabetes, saturated fat intake went down (for men, the absolute amount went down by 14%), and that there was no effect on the incidence of heart disease (although survival was better due to treatment), there is every reason to consider  the possibility of unexpected negative outcomes (think margarine and trans-fat).  Although now repealed, it is worth considering possible unintended consequences (since the sugar tax is still alive).  Suppose that the Danes had reduced consumption of saturated fat but still ate enough to bring in money. And suppose that this had the opposite effect — after all, if you believe the Jakobsen study, substituting carbohydrate for saturated fat will increase cardiovascular risk.  So now there would be a revenue stream that was associated with an increase in cardiovascular disease.  What would they have done?  What would we do? Well, we’d stop it, of course.  Yeah, right.

First published in October of 2011, this post announced a Q&A on line with Harvard’s Eric Rimm to answer question about the School of Public Health’s new  “Healthy Eating Plate,” its own version of nutritional recommendations to compete with the USDA’s MyPlate. A rather  limited window of one hour  was allotted for the entire country to phone in our questions.  Unfortunately HSPH was not as good at telecommunications as it is at epidemiology and the connection did not start working for a while.  The questions that I wanted to ask, however, still stand and this post is a duplicate of the original with the notice about the Q&A removed.  Harvard has been invited to participate in a panel discussion at the Ancestral Health Symposium, and we will see how these questions can be answered.

— adopted from Pops (at Louder and Smarter), the anonymous brilliant artist and admitted ne’er do well.

One of the questions surrounding USDA Nutrition Guidelines for Americans was whether so-called “sunshine laws,” like the Freedom of Information Act, were adhered to. Whereas hearings were recorded, and input from the public was solicited, there is the sense that if the letter of the law was followed, the spirit was weak.  When I and colleagues testified at the USDA hearings, there was little evidence that their representatives were listening; there was no discussion. We said our piece and then were heard no more.  In fact, at the break, when I tried to speak to one of the panel, somebody came out from backstage, I believe unarmed, to tell me that I could not discuss anything with the committee.

Harvard School of Public Health, home of  “odds ratio = 1.22,” last month published their own implementation of the one size-fits-all approach to public nutrition, the”Healthy Eating Plate.”  Their advice is full of  “healthy,” “packed with” and other self-praise that makes this mostly an infomercial for HSPH’s point of view. Supposedly a correction of the errors in MyPlate from the USDA, it seems to be more similar than different. The major similarity is the disdain for the intelligence of the American public. Comparing the two plates (below), they have exchanged the positions of fruits and vegetables.  “Grains” on MyPlate is now called “Whole Grains,” and “Protein” has been brilliantly changed to “Healthy Proteins.”  How many NIH grants were required to think of this is unknown.  Harvard will, of course, tell you what “healthy” is:, no red meat and, of course watch out for the Seventh Egg.


So here are the  questions that I wanted to ask:

  1. Dr. Rimm, you are recommending a diet for all Americans but even within the pattern of general recommendations, I don’t know of any experimental trial that has tested it.  Aren’t you just recommending another grand experiment like the original USDA recommendations which you are supposedly improving on?
  2. Dr. Rimm, given that half the population is overweight or obese shouldn’t there be at least two plates?
  3. Dr. Rimm, I think the American public expects a scientific document.  Don’t you think continued use of the words “healthy,” “packed with nutrients,” makes the Plate more of  an informercial for your point of view?
  4. Dr. Rimm, the Plate site says “The contents of this Web site are not intended to offer personal medical advice,” but it seems that is exactly what it is doing. If you say that you are recommending a diet that will “Lower blood pressure; reduced risk of heart disease, stroke, and probably some cancers; lower risk of eye and digestive problems,” how is that not medical advice?  Are you disowning responsibility for the outcome in advance?
  5. Dr. Rimm, more generally, how will you judge if these recommendations are successful? Is there a null hypothesis? The USDA recommendations continue from year to year without any considerations of past successes or failures.
  6. Dr. Rimm, “healthy” implies general consensus but there are many scientists and physicians with good credentials and experience who hold to different opinions. Have you considered these opinions in formulating the plate? Is there any room for dissent or alternatives?
  7. Dr. Rimm, the major alternative point of view is that low-carbohydrate diets offer benefits for weight loss and maintenance and, obviously, for diabetes and metabolic syndrome. Although your recommendations continually refer to regulation of blood sugar, it is not incorporated in the Plate.
  8. Dr. Rimm, nutritionally, fruits have more sugar, more calories, less potassium, fewer antioxidants than vegetables.  Why are they lumped together? And how can you equate beans, nuts and meat as a source of protein?
  9. Dr. Rimm, looking at the comparison of MyPlate and your Plate, it seems that all that is changed is that “healthy” has been added to proteins and “whole” has been added to grains.  If people know what “healthy” is, why is there an obesity epidemic? Or are you blaming the patient?
  10. Dr. Rimm, you are famous for disagreeing on lipids with the DGAC committee yet your name is on their report as well as on this document is supposed to be an alternative.  Do we know where you stand?
  11. Dr. Rimm, the Healthy Plate “differences” page says “The Healthy Eating Plate is based exclusively on the best available science and was not subjected to political and commercial pressures from food industry lobbyists.” This implies that the USDA recommendations are subject to such pressures.  What is the evidence for this? You were a member of the USDA panel. What pressures were brought to bear on you and how did you deal with them
  12. Dr. Rimm, the Healthy Plate still limits saturated fat even though a study from your department showed that there was, in fact, no effect of dietary saturated fat on cardiovascular disease.  That study, moreover, was an analysis of numerous previous trials, the great majority of which individually showed no risk from saturated fat. What was wrong with that study that allows you to ignore it?

*Medicineball, (colloq) a game that derives from Moneyball, in which an “unscientific culture responds, or fails to respond, to the scientific method ” in order  to stay funded.

Baseball is like church. Many attend. Few understand.

— Leo Durocher.

The movie Moneyball provides an affirmative answer to an important question in literature and drama: can you present a scene and bring out the character of a subject that is boring while, at the same time, not make the presentation boring?  The movie, and  Michael Lewis’sbook that it is based on, are about baseball and statistics!  For fans, baseball is not boring so much as incredibly slow, providing a soothing effect like fishing, interspersed with an occasional big catch. The movie stars Brad Pitt as Billy Beane, the General Manager of the Oakland Athletics baseball team in the 1990s.  A remarkably talented high school athlete, Billy Beane, for unknown reasons, was never able to play out his potential as an MLB player but, in the end, he had a decisive effect on the game at the managerial level. The question is how the A’s, with one-third of the budget of the Yankees, could have been in the play-offs three years in a row and, in 2001, could win 102 games.  The movie is more or less faithful to the book and both are as much about organizations and psychology as about sports. The story was “an example of how an unscientific culture responds, or fails to respond, to the scientific method” and the science is substantially statistical.

In America, baseball is a metaphor for just about everything. Probably because it is an experience of childhood and adolescence, lessons learned from baseball stay with us. Baby-boomers who grew up in Brooklyn were taught by Bobby Thompson’s 1951 home-run, as by nothing later, that life isn’t fair. The talking heads in Ken Burns’s Baseball who found profound meaning in the sport are good examples. Former New York Governor Mario Cuomo’s comments were quite philosophical although he did add the observation that getting hit in the head with a pitched ball led him to go into politics.

One aspect of baseball that is surprising, especially when you consider the money involved, is the extent to which strategy and scouting practices have generally ignored hard scientific data in favor of tradition and lore. Moneyball tells us about group think, self-deception and adherence to habit in the face of science. For those of us who a trying to make sense of the field of nutrition, where people’s lives are at stake and where numerous professionals who must know better insist on dogma — low fat, no red meat — in the face of contradictory evidence, baseball provides some excellent analogies.

The real stars of the story are the statistics and the computer or, more precisely, the statistics and computer guys: Bill James an amateur analyzer of baseball statistics and Paul DePodesta, assistant General Manager of the A’s who provided information about the real nature of the game and how to use this information. James self-published a photocopied book called 1977 baseball abstract: featuring 18 categories of statistical information you just can’t find anywhere else. The book was not just about statistics but was in fact a critique of traditional statistics pointing out, for example, that the concept of an “error;” was antiquated, deriving from the early days of gloveless fielders and un-groomed playing fields of the 1850s. In modern baseball, “you have to do something right to get an error; even if the ball is hit right at you, and you were standing in the right place to begin with.” Evolving rapidly, the Abstracts became a fixture of baseball life and are currently the premium (and expensive) way to obtain baseball information.

It is the emphasis on statistics that made people doubt that Moneyball could be made into a movie and is probably why they stopped shooting the first time around a couple of years ago. Also, although Paul DePodesta (above) is handsome and athletic, Hollywood felt that they should cast him as an overweight geek type played by Jonah Hill. All of the characters in the film have the names of the real people except for DePodesta “for legal reasons,” he says. Paul must have no sense of humor.

The important analogy with nutrition research and the continuing thread in this blog, is that it is about the real meaning of statistics. Lewis recognized that the thing that James thought was wrong with the statistics was that they

“made sense only as numbers, not as a language. Language, not numbers, is what interested him. Words, and the meaning they were designed to convey. ‘When the numbers acquire the significance of language,’ he later wrote, ‘they acquire the power to do all the things which language can do: to become fiction and drama and poetry … . And it is not just baseball that these numbers through a fractured mirror, describe. It is character. It is psychology, it is history, it is power and it is grace, glory, consistency….’”

By analogy, it is the tedious comparison of quintiles from the Harvard School of Public Health proving that white rice will give you diabetes but brown rice won’t or red meat is bad but white meat is not, odds ratio = 1.32. It is the bloodless, mindless idea that if the computer says so, it must be true, regardless of what common sense tells you. What Bill James and Paul DePodesta brought to the problem was understanding that the computer will only give you a meaningful answer if you ask the right question; asking what behaviors accumulated runs and won ball games, not which physical characteristics — runs fast, looks muscular — that seem to go with being a ball player… the direct analog of “you are what you eat,” or the relative importance of lowering you cholesterol vs whether you actually live or die.

As early as the seventies, the computer had crunched baseball stats and come up with clear recommendations for strategy. The one I remember, since it was consistent with my own intuition, was that a sacrifice bunt was a poor play; sometimes it worked but you were much better off, statistically, having every batter simply try to get a hit. I remember my amazement at how little effect the computer results had on the frequency of sacrifice bunts in the game. Did science not count? What player or manager did not care whether you actually won or lost a baseball game. The themes that are played out in Moneyball, is that tradition dies hard and we don’t like to change our mind even for our own benefit. We invent ways to justify our stubbornness and we focus on superficial indicators rather than real performance and sometimes we are just not real smart.

Among the old ideas, still current, was that the batting average is the main indicator of a batter’s strength. The batting average is computed by considering that a base-on-balls is not an official at bat whereas a moments thought tells you that the ability to avoid bad pitches is an essential part of the batter’s skill. Early on, even before he was hired by Billy Beane, Paul DePodesta had run the statistics from every twentieth century baseball team. There were only two offensive statistics that were important for a winning team percentage: on-base percentage (which included walks) and slugging percentage. “Everything else was far less important.” These numbers are now part of baseball although I am not enough of a fan to know the extent to which they are still secondary to the batting average.

One of the early examples of the conflict between tradition and science was the scouts refusal to follow up on the computer’s recommendation to look at a fat, college kid named Kevin Youkilis who would soon have the second highest on-base percentage after Barry Bonds. “To Paul, he’d become Euclis: the Greek god of walks.”

The big question in nutrition is how the cholesterol-diet-heart paradigm can persist in the face of the consistent failures of experimental and clinical trials to provide support. The story of these failures and the usurpation of the general field by idealogues has been told many times. Gary Taubes’s Good Calories, Bad Calories is the most compelling and, as I pointed out in a previous post, there seems to have been only one rebuttal, Steinberg’s Cholesterol Wars. The Skeptics vs. the Preponderance of Evidence. At least within the past ten year, a small group have tried to introduce new ideas, in particular that it is excessive consumption of dietary carbohydrate, not dietary fat, that is the metabolic component of the problems in obesity, diabetes and heart disease and have provided extensive, if generally un-referenced, experimental support. An analogous group tried to influence baseball in the years before Billy Beane. Larry Lucchino, an executive of the San Diego Padres described the group in baseball as being perceived as something of a cult and therefore easily dismissed. “There was a profusion of new knowledge and it was ignored.” As described in Moneyball “you didn’t have to look at big-league baseball very closely to see its fierce unwillingness to rethink any it was as if it had been inoculated against outside ideas.”

“Grady Fuson, the A’s soon to be former head of scouting, had taken a high school pitcher named Jeremy Bonderman and the kid had a 94 mile-per-hour fastball, a clean delivery, and a body that looked as if it had been created to wear a baseball uniform. He was, in short, precisely the kind of pitcher Billy thought he had trained the scouting department to avoid…. Taking a high school pitcher in the first round — and spending 1.2 million bucks to sign — that was exactly this sort of thing that happened when you let scouts have their way. It defied the odds; it defied reason. Reason, even science, was what Billy Beane was intent on bringing to baseball.”

The analogy is to the deeply ingrained nutritional tradition, the continued insistence on cholesterol and dietary fat that are assumed to have evolved in human history in order to cause heart disease. The analogy is the persistence of the lipophobes, in the face of scientific results showing, at every turn, that these were bad ideas, that, in fact, dietary saturated fat does not cause heart disease. It leads, in the end, to things like Steinberg’s description of the Multiple risk factor intervention trial. (MRFIT; It’s better not to be too clever on acronyms lest the study really bombs out): “Mortality from CHD was 17.9 deaths per 1,000 in the [intervention] group and 19.3 per 1,000 in the [control] group, a statistically nonsignificant difference of 7.1%”). Steinberg’s take on MRFIT:

“The study failed to show a significant decrease in coronary heart disease and is often cited as a negative study that challenges the validity of the lipid hypothesis. However, the difference in cholesterol level between the controls and those on the lipid lowering die was only about 2 per cent. This was clearly not a meaningful test of the lipid hypothesis.”

In other words, cholesterol is more important than outcome or at least a “diet designed to lower cholesterol levels, along with advice to stop smoking and advice on exercise” may still be a good thing.

Similarly, the Framingham study which found a strong association between cholesterol and heart disease found no effect of dietary fat, saturated fat or cholesterol on cardiovascular disease.  Again, a marker for risk is more important than whether you get sick.  “Scouts” who continued to look for superficial signs and ignore seemingly counter-intuitive conclusions from the computer still hold sway on the nutritional team.

“Grady had no way of knowing how much Billy disapproved of Grady’s most deeply ingrained attitude — that Billy had come to believe that baseball scouting was at roughly the same stage of development in the twenty-first century as professional medicine had been in the eighteenth.”

Professional medicine? Maybe not the best example.

What is going on here? Physicians, like all of us, are subject to many reinforcers but for humans power and control are usually predominant and, in medicine, that plays out most clearly in curing the patient. Defeating disease shines through even the most cynical analysis of physician’s motivations. And who doesn’t play baseball to win. “The game itself is a ruthless competition. Unless you’re very good, you don’t survive in it.”

Moneyball describes a “stark contrast between the field of play and the uneasy space just off it, where the executives in the Scouts make their livings.” For the latter, read the expert panels of the American Heat Association and the Dietary Guidelines committee, the Robert Eckels who don’t even want to study low carbohydrate diets (unless it can be done in their own laboratory with NIH money). In this

“space just off the field of play there really is no level of incompetence that won’t be tolerated. There are many reasons for this, but the big one is that baseball has structured itself less as a business and as a social club. The club includes not only the people who manage the team but also in a kind of women’s auxiliary many of the writers and commentators to follow and purport to explain. The club is selective, but the criteria for admission and retention and it is there many ways to embarrass the club, but being bad at your job isn’t one of them. The greatest offense a club member can commit is not ineptitude but disloyalty.”

The vast NIH-USDA-AHA social club does not tolerate dissent. And the media, WebMD, Heart.org and all the networks from ABCNews to Huffington Post will be there to support the club. The Huffington Post, who will be down on the President of the United States in a moment, will toe the mark when it comes to a low carbohydrate story.

The lessons from money ball are primarily in providing yet another precedent for human error, stubbornness and, possibly even stupidity, even in an area where the stakes are high. In other words, the nutrition mess is not in our imagination. The positive message is that there is, as they say in political science, validator satisfaction. Science must win out. The current threat is that the nutritional establishment is, as I describe it, slouching toward low-carb, doing small experiments, and easing into a position where they will say that they never were opposed to the therapeutic value of carbohydrate restriction. A threat because they will try to get their friends funded to repeat, poorly, studies that have already been done well. But that is another story, part of the strange story of Medicineball.

“Doctors prefer large studies that are bad to small studies that are good.”

— anon.

The paper by Foster and coworkers entitled Weight and Metabolic Outcomes After 2 Years on a Low-Carbohydrate Versus Low-Fat Diet, published in 2010, had a surprisingly limited impact, especially given the effect of their first paper in 2003 on a one-year study.  I have described the first low carbohydrate revolution as taking place around that time and, if Gary Taubes’s article in the New York Times Magazine was the analog of Thomas Paine’s Common Sense, Foster’s 2003 paper was the shot hear ’round the world.

The paper showed that the widely accepted idea that the Atkins diet, admittedly good for weight loss, was a risk for cardiovascular disease, was not true.  The 2003 Abstract said “The low-carbohydrate diet was associated with a greater improvement in some risk factors for coronary heart disease.” The publication generated an explosive popularity of the Atkins diet, ironic in that Foster had said publicly that he undertook the study in order to “once and for all,” get rid of the Atkins diet.  The 2010 paper by extending the study to 2 years would seem to be very newsworthy.  So what was wrong?  Why is the new paper more or less forgotten?  Two things.  First, the paper was highly biased and its methods were so obviously flawed — obvious even to the popular press — that it may have been a bit much even for the media. It remains to be seen whether it will really be cited but I will suggest here that it is a classic in misleading research and in the foolishness of intention-to-treat (ITT).

(more…)

Asher Peres was a physicist, an expert in information theory who died in 2005 and was remembered for his scientific contributions as well as for his iconoclastic wit and ironic aphorisms. One of his witticisms was that “unperformed research has no results ”  Peres had undoubtedly never heard of intention-to-treat (ITT), the strange statistical method that has appeared recently, primarily in the medical literature.  According to ITT, the data from a subject assigned at random to an experimental group must be included in the reported outcome data for that group even if the subject does not follow the protocol, or even if they drop out of the experiment.  At first hearing, the idea is counter-intuitive if not completely idiotic  – why would you include people who are not in the experiment in your data? – suggesting that a substantial burden of proof rests with those who want to employ it.  No such obligation is usually met and particularly in nutrition studies, such as comparisons of isocaloric weight loss diets, ITT is frequently used with no justification and sometimes demanded by reviewers.   Not surprisingly, there is a good deal of controversy on this subject.  Physiologists or chemists, hearing this description usually walk away shaking their head or immediately come up with one or another obvious reductio ad absurdum, e.g. “You mean, if nobody takes the pill, you report whether or not they got better anyway?” That’s exactly what it means.

On the naive assumption that some people really didn’t understand what was wrong with ITT — I’ve been known to make a few elementary mistakes in my life — I wrote a paper on the subject.  It received negative, actually hostile. reviews from two public health journals — I include an amusing example at the end of this post.  I even got substantial grief from Nutrition & Metabolism, where I was the editor at the time, but where it was finally published.  The current post will be based on that paper and I will provide a couple of interesting cases from the medical literature.  In the next post I will discuss a quite remarkable new instance — Foster’s two year study of low carbohydrate diets — of the abuse of common sense that is the major alternative to ITT.

To put a moderate spin on the problem, there is nothing wrong with ITT, if you explicitly say what the method shows — the effect of assigning subjects to an experimental protocol; the title of my paper was Intention-to-treat.  What is the question? If you are very circumspect about that question, then there is little problem.  It is common, however, for the Abstract of a paper to correctly state that patients “were assigned to a diet” but by the time the Results are presented, the independent variable has become, not “assignment to the diet,” but “the diet” which most people would assume meant what people ate, rather than what they were told to eat. Caveat lector.  My paper was a kind of over-kill and I made several different arguments but the common sense argument gets to the heart of the problem in a practical way.  I’ll describe that argument and also give a couple of real examples.

Common sense argument against intention-to-treat

Consider an experimental comparison of two diets in which there is a simple, discrete outcome, e.g. a threshold amount of weight lost or remission of an identifiable symptom. Patients are randomly assigned to two different diets: diet group A or diet group B and a target of, say, 5 kg weight loss is considered success. As shown in the table above, in group A, half of the subject are able to stay on the diet but, for whatever reason, half are not. The half of the patients in group A who did stay on the diet, however, were all able to lose the target 5 kg.  In group B, on the other hand, everybody is able to stay on the diet but only half are able to lose the required amount of weight. An ITT analysis shows no difference in the two outcomes, while just looking at those people who followed the diet shows 100 % success.  This is one of the characteristics of ITT: it always makes the better diet look worse than it is.

         Diet A         Diet B
Compliance (of 100 patients)   50   100
Success (reached target)   50    50
ITT success   50/100 = 50%   50/100 = 50%
“per protocol” (followed diet) success   50/50 = 100%   50/100 = 50%

Now, you are the doctor.  With such data in hand should you advise a patient: “well, the diets are pretty much the same. It’s largely up to you which you choose,” or, looking at the raw data (both compliance and success), should the recommendation be: “Diet A is much more effective than diet B but people have trouble staying on it. If you can stay on diet A, it will be much better for you so I would encourage you to see if you could find a way to do so.” Which makes more sense? You’re the doctor.

I made several arguments trying to explain that there are two factors, only one of which (whether it works) is clearly due to the diet. The other (whether you follow the diet) is under control of other factors (whether WebMD tells you that one diet or the other will kill you, whether the evening news makes you lose your appetite, etc.)  I even dragged in a geometric argument because Newton had used one in the Principia: “a 2-dimensional outcome space where the length of a vector tells how every subject did…. ITT represents a projection of the vector onto one axis, in other words collapses a two dimensional vector to a one-dimensional vector, thereby losing part of the information.” Pretentious? Moi?

Why you should care.  Case I. Surgery or Medicine?

Does your doctor actually read these academic studies using ITT?  One can only hope not.  Consider the analysis by Newell  of the Coronary Artery Bypass Surgery (CABS) trial.  This paper is astounding for its blanket, tendentious insistence on what is correct without any logical argument.  Newell considers that the method of

 “the CABS research team was impeccable. They refused to do an ‘as treated’ analysis: ‘We have refrained from comparing all patients actually operated on with all not operated on: this does not provide a measure of the value of surgery.”

Translation: results of surgery do not provide a measure of the value of surgery.  So, in the CABS trial, patients were assigned to Medicine or Surgery. The actual method used and the outcomes are shown in the Table below. Intention-to-treat analysis was, as described by Newell, “used, correctly.” Looking at the table, you can see that a 7.8% mortality was found in those assigned to receive medical treatment (29 people out of 373 died), and a 5.3% mortality (21 deaths out of 371) for assignment to surgery.  If you look at the outcomes of each modality as actually used, it turns out that that medical treatment had a 9.5% (33/349) mortality rate compared with 4.1% (17/419) for surgery, an analysis that Newell says “would have wildly exaggerated the apparent value of surgery.”

Survivors and deaths after allocation to surgery or medical treatment
Allocated medicine Allocated surgery
  Received surgery     Received medicine   Received surgery     Received medicine
Survived 2 years   48   296   354   20
Died    2    27    15    6
Total   50   323   369   26

Common sense suggests that appearances are not deceiving. If you were one of the 33-17 = 16 people who were still alive, you would think that it was the potential report of your death that had been exaggerated.  The thing that is under the control of the patient and the physician, and which is not a feature of the particular modality, is getting the surgery implemented. Common sense dictates that a patient is interested in surgery, not the effect of being told that surgery is good.  The patient has a right to expect that if they comply, the physician would avoid conditions where, as stated by Hollis,  “most types of deviations from protocol would continue to occur in routine practice.” The idea that “Intention to treat analysis is … most suitable for pragmatic trials of effectiveness rather than for explanatory investigations of efficacy” assumes that practical considerations are the same everywhere and that any practitioner is locked into the same abilities or lack of abilities as the original experimenter.

What is the take home message.  One general piece of advice that I would give based on this discussion in the medical literature: don’t get sick.

Why you should care.  Case II. The effect of vitamin E supplementation

A clear cut case of how off-the-mark ITT can be is a report on the value of antioxidant supplements. The Abstract of the paper concluded that “there were no overall effects of ascorbic acid, vitamin E, or beta carotene on cardiovascular events among women at high risk for CVD.” The study was based on an ITT analysis but,on the fourth page of the paper, it turns out that removing subjects due to

“noncompliance led to a significant 13% reduction in the combined end point of CVD morbidity and mortality… with a 22% reduction in MI …, a 27% reduction in stroke …. a 23% reduction in the combination of MI, stroke, or CVD death (RR (risk ratio), 0.77; 95% CI, 0.64–0.92 [P = 005]).”

The media universally reported the conclusion from the Abstract, namely that there was no effect of vitamin E. This conclusion is correct if you think that you can measure the effect of vitamin E without taking the pill out of the bottle.  Does this mean that vitamin E is really of value? The data would certainly be accepted as valuable if the statistics were applied to a study of the value of replacing barbecued pork with whole grain cereal. Again, “no effect” was the answer to the question: “what happens if you are told to take vitamin E” but it still seems is reasonable that the effect of a vitamin means the effect of actually taking the vitamin.

The ITT controversy

Advocates of ITT see its principles as established and may dismiss a common sense approach as naïve. The issue is not easily resolved; statistics is not axiomatic: there is no F=ma, there is no zeroth law.  A good statistics book will tell you in the Introduction that what we do in statistics is to try to find a way to quantify our intuitions. If this is not appreciated, and you do not go back to consideration of exactly what the question is that you are asking, it is easy to develop a dogmatic approach and insist on a particular statistic because it has become standard.

As I mentioned above, I had a good deal of trouble getting my original paper published and one  anonymous reviewer said that “the arguments presented by the author may have applied, maybe, ten or fifteen years ago.” This criticism reminded me of Molière’s Doctor in Spite of Himself:

Sganarelle is disguised as a doctor and spouts medical double-talk with phony Latin, Greek and Hebrew to impress the client, Geronte, who is pretty dumb and mostly falls for it but:

Geronte: …there is only one thing that bothers me: the location of the liver and the heart. It seemed to me that you had them in the wrong place: the heart is on the left side but the liver is on the right side.

Sgnarelle: Yes. That used to be true but we have changed all that and medicine uses an entirely new approach.

Geronte: I didn’t know that and I beg your pardon for my ignorance.

 In the end, it is reasonable that scientific knowledge be based on real observations. This has never before been thought to include data that was not actually in the experiment. I doubt that nous avons changé tout cela.

“These results suggest that there is no superior long-term metabolic benefit of a high-protein diet over a high-carbohydrate in the management of type 2 diabetes.”  The conclusion is from a paper by Larsen, et al. [1] which, based on that statement in the Abstract, I would not normally bother to read; it is good that you have to register trials and report failures but from a broader perspective, finding nothing is not great news and just because Larsen couldn’t do it, doesn’t mean it can’t be done.  However, in this case, I received an email from International Diabetes published bilingually in Beijing: “Each month we run a monthly column where choose a hot-topic article… and invite expert commentary opinion about that article” so I agreed to write an opinion. The following is my commentary:

“…no superior long-term metabolic benefit of a high-protein diet over a high-carbohydrate ….” A slightly more positive conclusion might have been that “a high-protein diet is as good as a high carbohydrate diet.”  After all, equal is equal. The article is, according to the authors, about “high-protein, low-carbohydrate” so rather than describing a comparison of apples and pears, the conclusion should emphasize low carbohydrate vs high carbohydrate.   It is carbohydrate, not protein, that is the key question in diabetes but clarity was probably not the idea. The paper by Larsen, et al. [1] represents a kind of classic example of the numerous studies in the literature whose goal is to discourage people with diabetes from trying a diet based on carbohydrate restriction, despite its intuitive sense (diabetes is a disease of carbohydrate intolerance) and despite its established efficacy and foundations in basic biochemistry.  The paper is characterized by blatant bias, poor experimental design and mind-numbing statistics rather than clear graphic presentation of the data. I usually try to take a collegial approach in these things but this article does have a unique and surprising feature, a “smoking gun” that suggests that the authors were actually aware of the correct way to perform the experiment or at least to report the data.

Right off, the title tells you that we are in trouble. “The effect of high-protein, low-carbohydrate diets in the treatment…” implying that all such diets are the same even though  there are several different versions, some of which (by virtue of better design) will turn out to have had much better performance than the diet studied here and, almost all of which are not “high protein.” Protein is one of the more stable features of most diets — the controls in this experiment, for example, did not substantially lower their protein even though advised to do so –and most low-carbohydrate diets advise only carbohydrate restriction.  While low-carbohydrate diets do not counsel against increased protein, they do not necessarily recommend it.  In practice, most carbohydrate-restricted diets are hypocaloric and the actual behavior of dieters shows that they generally do not add back either protein or fat, an observation first made by LaRosa in 1980.

Atkins-bashing is not as easy as it used to be when there was less data and one could run on “concerns.” As low-fat diets continue to fail at both long-term and short-term trials — think Women’s Health Initiative [2] — and carbohydrate restriction continues to show success and continues to bear out the predictions from the basic biochemistry of the insulin-glucose axis  [3], it becomes harder to find fault.  One strategy is to take advantage of the lack of formal definitions of low-carbohydrate diets to set up a straw man.  The trick is to test a moderately high carbohydrate diet and show that, on average, as here, there is no difference in hemoglobin A1c, triglycerides and total cholesterol, etc. when compared to a higher carbohydrate diet as control —  the implication is that in a draw, the higher carbohydrate diet wins.  So, Larsen’s low carbohydrate diet contains 40 % of energy as carbohydrate.  Now, none of the researchers who have demonstrated the potential of carbohydrate restriction would consider 40 % carbohydrate, as used in this study, to be a low-carbohydrate diet. In fact, 40 % is close to what the American population consumed before the epidemic of obesity and diabetes. Were we all on a low carbohydrate diet before Ancel Keys?

What happened?  As you might guess, there weren’t notable differences on most outcomes but like other such studies in the literature, the authors report only group statistics so you don’t really know who ate what and they use an intention-to-treat (ITT) analysis. According to ITT, a research report should include data from those subjects that dropped out of the study (here, about 19 % of each group). You read that correctly.  The idea is based on the assumption (insofar as it has any justification at all) that compliance is an inherent feature of the diet (“without carbs, I get very dizzy”) rather than a consequence of bias transmitted from the experimenter, or distance from the hospital, or any of a thousand other things.  While ITT has been defended vehemently, the practice is totally counter-intuitive, and has been strongly attacked on any number of grounds, the most important of which is that, in diet experiments, it makes the better diet look worse.  Whatever the case that can be made, however, there is no justification for reporting only intention-to-treat data, especially since, in this paper, the authors consider as one of the “strengths of the study … the measurement of dietary compliance.”

The reason that this is all more than technical statistical detail, is that the actual reported data show great variability (technically, the 95 % confidence intervals are large).  To most people, a diet experiment is supposed to give a prospective dieter information about outcome.  Most patients would like to know: if I stay on this diet, how will I do.  It is not hard to understand that if you don’t stay on the diet, you can’t expect good results.  Nobody knows what 81 % staying on the diet could mean.  In the same way, nobody loses an average amount of weight. If you look at  the spread in performance and in what was consumed by individuals on this diet, you can see that there is big individual variation Also, being “on a diet”, or being “assigned to a diet” is very different than actually carrying out dieting behavior, that is, eating a particular collection of food.  When there is wide variation, a person in the low-carb group may be eating more carbs than some person in the high-carb group.  It may be worth testing the effect of having the doctor tell you to eat fewer carbs, but if you are trying to lose weight, you want them to test the effect of actually eating fewer carbs.

When I review papers like this for a journal I insist that the authors present individual data in graphic form.  The question in low-carbohydrate diets is the effect of amount of carbohydrate consumed on the outcomes.  Making a good case to the reader involves showing individual data.  As a reviewer, I would have had the authors plot each individual’s consumption of carbohydrate vs for example, individual changes in triglyceride and especially HbA1c.  Both of these are expected to be dependent on carbohydrate consumption.  In fact, this is the single most common criticism I make as reviewer or that I made when I was co-editor-in chief at Nutrition and Metabolism.

So what is the big deal?  This is not the best presentation of the data and it is really hard to tell what the real effect of carbohydrate restriction is. Everybody makes mistakes and few of my own papers are without some fault or other. But there’s something else here.  In reading a paper like this, unless you suspect that something wasn’t done correctly, you don’t tend to read the Statistical analysis section of the Methods very carefully (computers have usually done most of the work).  In this paper, however, the following remarkable paragraph jumps out at you.  A real smoking gun:

  • “As this study involved changes to a number of dietary variables (i.e. intakes of calories, protein and carbohydrate), subsidiary correlation analyses were performed to identify whether study endpoints were a function of the change in specific dietary variables. The regression analysis was performed for the per protocol population after pooling data from both groups. “

What?  This is exactly what I would have told them to do.  (I’m trying to think back. I don’t think I reviewed this paper).  The authors actually must have plotted the true independent variable, dietary intake — carbohydrate, calories, etc. — against the outcomes, leaving out the people who dropped out of the study.  So what’s the answer?

  • “These tests were interpreted marginally as there was no formal adjustment of the overall type 1 error rate and the p values serve principally to generate hypotheses for validation in future studies.”

Huh?  They’re not going to tell us?  “Interpreted marginally?”  What the hell does that mean?  A type 1 error refers to a false positive, that is, they must have found a correlation between diet and outcome in distinction to what the conclusion of the paper is.  They “did not formally adjust for” the main conclusion?  And “p values serve principally to generate hypotheses?”  This is the catch-phrase that physicians are taught to dismiss experimental results that they don’t like.  Whether it means anything or not, in this case there was a hypothesis, stated right at the beginning of the paper in the Abstract: “…to determine whether high-protein diets are superior to high-carbohydrate diets for improving glycaemic control in individuals with type 2 diabetes.”

So somebody — presumably a reviewer — told them what to do but they buried the results.  My experience as an editor was, in fact, that there are people in nutrition who think that they are beyond peer review and I had had many fights with authors.  In this case, it looks like the actual outcome of the experiment may have actually been the opposite of what they say in the paper.  How can we find out?  Like most countries, Australia has what are called “sunshine laws,” that require government agencies to explain their actions.  There is a Australian Federal Freedom of Information Act (1992) and one for the the state of Victoria (1982). One of the authors is supported by NHMRC (National Health and Medical Research Council)  Fellowship so it may be they are obligated to share this marginal information with us.  Somebody should drop the government a line.

Bibliography

1. Larsen RN, Mann NJ, Maclean E, Shaw JE: The effect of high-protein, low-carbohydrate diets in the treatment of type 2 diabetes: a 12 month randomised controlled trial. Diabetologia 2011, 54(4):731-740.

2. Tinker LF, Bonds DE, Margolis KL, Manson JE, Howard BV, Larson J, Perri MG, Beresford SA, Robinson JG, Rodriguez B et al: Low-fat dietary pattern and risk of treated diabetes mellitus in postmenopausal women: the Women’s Health Initiative randomized controlled dietary modification trial. Arch Intern Med 2008, 168(14):1500-1511.

3. Volek JS, Phinney SD, Forsythe CE, Quann EE, Wood RJ, Puglisi MJ, Kraemer WJ, Bibus DM, Fernandez ML, Feinman RD: Carbohydrate Restriction has a More Favorable Impact on the Metabolic Syndrome than a Low Fat Diet. Lipids 2009, 44(4):297-309.