Archive for the ‘saturated fat’ Category

…what metaphysics is to physics. The old joke came to mind when a reporter asked me yesterday to comment on a paper published in the BMJ. “Intake of saturated and trans unsaturated fatty acids and risk of all cause mortality, cardiovascular disease, and type 2 diabetes: systematic review and meta-analysis of observational studies” by de Souza, et al.

Now the title ““Intake of saturated and trans unsaturated fatty acids…” tells you right off that this is not good news; lumping together saturated fat and trans-fat represents a clear  indication of bias. A stand-by of Atkins-bashers, it is a way of vilifying saturated fat when the data won’t fit.  In the study that the reporter asked about, the BMJ provided a summary:

“There was no association between saturated fats and health outcomes in studies where saturated fat generally replaced refined carbohydrates, but there was a positive association between total trans fatty acids and health outcomes Dietary guidelines for saturated and trans fatty acids must carefully consider the effect of replacement nutrients.”

“But?” The two statements are not really connected. In any case the message is clear: saturated fat is Ok. Trans-fat is not Ok. So, we have to be concerned about both  saturated fat and trans-fat. Sad.

And “systematic” means the system that the author wants to use. This usually means “we searched the database of…” and then a meta-analysis. Explained by the overly optimistic “What is …?” series:

Meta-anal_WhatIs

The jarring notes are “precise estimate” in combination with “combining…independent studies.” In practice, you usually only repeat an experiment exactly if you suspect that something was wrong with the original study or if the result is sufficiently outside expected values that you want to check it. Such an examination sensibly involves a fine-grained analysis of the experimental details. The idea underlying the meta-analysis, however, usually unstated, is that the larger the number of subjects in a study, the more compelling the conclusion. One might make the argument, instead, that if you have two or more studies which are imperfect, combining them is likely to lead to greater uncertainty and more error, not less.  I am one who would make such an argument. So where did meta-analysis come from and what, if anything, is it good for?

I am trained in enzyme and protein chemistry but I have worked in a number of different  fields including invertebrate animal behavior. I never heard of meta-analysis until very recently, that is, until I started doing research in nutrition. In fact, in 1970 there weren’t any meta-analyses, at least not with that phrase in the title, or at least not as determined by my systematic PubMed search. By 1990, there were about a 100 and by 2014, there were close to 10, 000 (Figure 1).

Meta-anal_Year_Mar9Figure 1. Logarithm of the number of papers in PubMed search with the title containing “meta-analysis” vs. Year of publication

This exponential growth suggests that the technique grew by reproducing itself. It suggests, in fact, that its origins are in spontaneous generation. In other words, it is popular because it is popular. (It does have obvious advantages; you don’t have to do any experiments). But does it give any useful information?

Meta-analysis

If you have a study that is under-powered, that is, if you only have a small number of subjects, and you find a degree of variability in the outcome, then combining the results from your experiment with another small study may point you to a consistent pattern. As such, it is a last-ditch, Hail-Mary kind of method. Applying it to large studies that have statistically meaningful results, however, doesn’t make sense, because:

  1. If all of the studies go in the same direction, you are unlikely to learn anything from combining them. In fact, if you come out with a value for the output that is different from the value from the individual studies, in science, you are usually required to explain why your analysis improved things. Just saying it is a larger n won’t cut it, especially if it is my study that you are trying to improve on.
  2. In the special case where all the studies show no effect and you come up with a number that is statistically significant, you are, in essence saying that many wrongs can make a right as described in a previous blog post on abuse of meta-analyses.  In that post, I re-iterated the statistical rule that if the 95% CI bar crosses the line for hazard ratio = 1.0 then this is taken as an indication that there is no significant difference between the two conditions that are being compared. The example that I gave was the meta-analysis by Jakobsen, et al. on the effects of SFAs or a replacement on CVD outcomes (Figure 2). Amazingly, in the list of 15 different studies that she used, all but one cross the hazard ratio = 1.0 line. In other words, only one study found that keeping SFAs in the diet provides a lower risk than replacement with carbohydrate. For all the others there was no significant difference.  The question is why an analysis was done at all.  What could we hope to find? How could 15 studies that show nothing add up to a new piece of information? Most amazing is that some of the studies are more than 20 years old. How could these have had so little impact on our opinion of saturated fat?  Why did we keep believing that it was bad?

SFA_Jakobsen_Sub_AJCN-2_2009

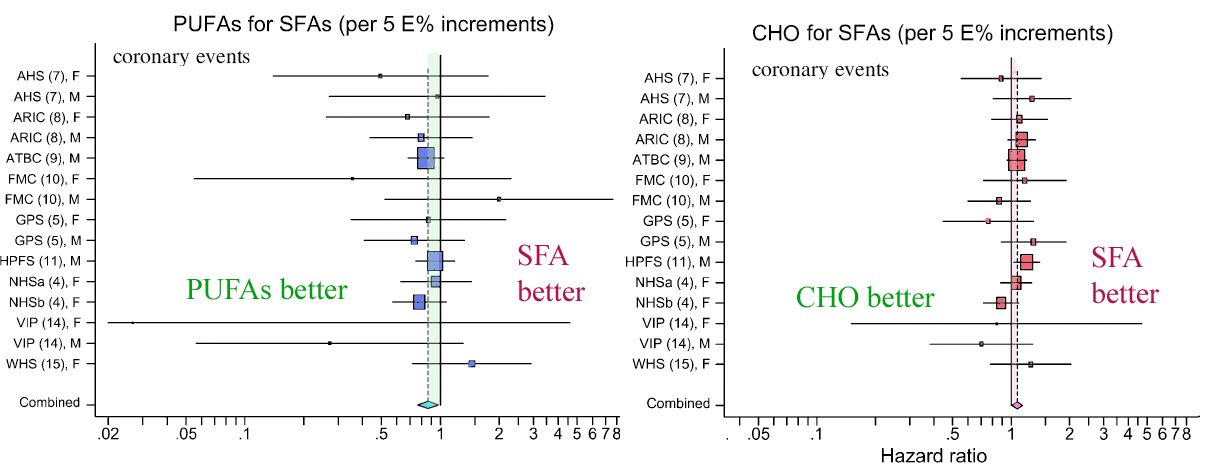
Figure 2. Hazard ratios and 95% confidence intervals for coronary events and deaths in the different studies in a meta-analysis from Jakobsen, et al.Major types of dietary fat and risk of coronary heart disease: a pooled analysis of 11 cohort studies. Am J Clin Nutr 2009, 89(5):1425-1432.

3. Finally, suppose that you are doing a meta-analysis on several studies and that they have very different outcomes, showing statistically significant associations in different directions. For example, if some studies showed substituting saturated fat for carbohydrate increased risk while some showed that it decreased risk. What will you gain by averaging them? I don’t know about you but it doesn’t sound good to me. It makes me think of the old story of the emerging nation that was planning to build a railroad and didn’t know whether to use a gauge that matched the country to the north or the gauge of the country to the south. The parliament voted to use a gauge that was the average of the two.

The  SBU (Swedish Council on Health Technology Assessment) is charged by the Swedish government with assessing health care treatments. Their recent acceptance of low-carbohydrate diets as best for weight loss is one of the signs of big changes in nutrition policy.  I am happy to reveal the next bombshell, this time from the American Diabetes Association (ADA) which will finally recognize the importance of reducing carbohydrate as the primary therapy in type 2 diabetes and as an adjunct in type 1.  Long holding to a very reactionary policy — while there were many disclaimers, the ADA has previously held 45 – 60 % carbohydrate as some kind of standard — the agency has been making slow progress. A member of the writing committee who wishes to remain anonymous has given me a copy of the 2014 nutritional guidelines due to be released next year, an excerpt from which, I reproduce below. (more…)

TIME: You’re partnering with, among others, Harvard University on this. In an alternate Lady Gaga universe, would you have liked to have gone to Harvard?

Lady Gaga: I don’t know. I am going to Harvard today. So that’ll do.

— Belinda Luscombe, Time Magazine, March 12, 2012

There was a sense of déja-vu about the latest red meat scare and I thought that my previous post as well as those of others had covered the bases but I just came across a remarkable article from the Harvard Health Blog. It was entitled “Study urges moderation in red meat intake.” It describes how the “study linking red meat and mortality lit up the media…. Headline writers had a field day, with entries like ‘Red meat death study,’ ‘Will red meat kill you?’ and ‘Singing the blues about red meat.”’

What’s odd is that this is all described from a distance as if the study by Pan, et al (and likely the content of the blog) hadn’t come from Harvard itself but was rather a natural phenomenon, similar to the way every seminar on obesity begins with a slide of the state-by-state development of obesity as if it were some kind of meteorologic event.

When the article refers to “headline writers,” we are probably supposed to imagine sleazy tabloid publishers like the ones who are always pushing the limits of first amendment rights in the old Law & Order episodes.  The Newsletter article, however, is not any less exaggerated itself. (My friends in English Departments tell me that self-reference is some kind of hallmark of real art). And it is not true that the Harvard study was urging moderation. In fact, it is admitted that the original paper “sounded ominous. Every extra daily serving of unprocessed red meat (steak, hamburger, pork, etc.) increased the risk of dying prematurely by 13%. Processed red meat (hot dogs, sausage, bacon, and the like) upped the risk by 20%.” That is what the paper urged. Not moderation. Prohibition. Who wants to buck odds like that? Who wants to die prematurely?

It wasn’t just the media. Critics in the blogosphere were also working over-time deconstructing the study.  Among the faults that were cited, a fault common to much of the medical literature and the popular press, was the reporting of relative risk.

The limitations of reporting relative risk or odds ratio are widely discussed in popular and technical statistical books and I ran through the analysis in the earlier post. Relative risk destroys information.  It obscures what the risks were to begin with.  I usually point out that you can double your odds of winning the lottery if you buy two tickets instead of one. So why do people keep doing it?  One reason, of course, is that it makes your work look more significant.  But, if you don’t report the absolute change in risk, you may be scaring people about risks that aren’t real. The nutritional establishment is not good at facing their critics but on this one, they admit that they don’t wish to contest the issue.

Nolo Contendere.

“To err is human, said the duck as it got off the chicken’s back”

 — Curt Jürgens in The Devil’s General

Having turned the media loose to scare the American public, Harvard now admits that the bloggers are correct.  The Health NewsBlog allocutes to having reported “relative risks, comparing death rates in the group eating the least meat with those eating the most. The absolute risks… sometimes help tell the story a bit more clearly. These numbers are somewhat less scary.” Why does Dr. Pan not want to tell the story as clearly as possible?  Isn’t that what you’re supposed to do in science? Why would you want to make it scary?

The figure from the Health News Blog:

Deaths per 1,000 people per year

    1 serving unprocessed meat a week   2 servings unprocessed meat a day
    Women    

7.0

8.5
    3 servings unprocessed meat a week   2 servings unprocessed meat a day
    Men

12.3

13.0

Unfortunately, the Health Blog doesn’t actually calculate the  absolute risk for you.  You would think that they would want to make up for Dr. Pan scaring you.   Let’s calculate the absolute risk.  It’s not hard.Risk is usually taken as probability, that is, number cases divided by total number of participants.  Looking at the men, the risk of death with 3 servings per week is equal to the 12.3 cases per 1000 people = 12.3/1000 = 0.1.23 = 1.23 %. Now going to 14 servings a week (the units in the two columns of the table are different) is 13/1000 = 1.3 % so, for men, the absolute difference in risk is 1.3-1.23 = 0.07, less than 0.1 %.  Definitely less scary. In fact, not scary at all. Put another way, you would have to drastically change the eating habits (from 14 to 3 servings) of 1, 429 men to save one life.  Well, it’s something.  Right? After all for millions of people, it could add up.  Or could it?  We have to step back and ask what is predictable about 1 % risk. Doesn’t it mean that if a couple of guys got hit by cars in one or another of the groups whether that might not throw the whole thing off? in other words, it means nothing.

Observational Studies Test Hypotheses but the Hypotheses Must be Testable.

It is commonly said that observational studies only generate hypotheses and that association does not imply causation.  Whatever the philosophical idea behind these statements, it is not exactly what is done in science.  There are an infinite number of observations you can make.  When you compare two phenomena, you usually have an idea in mind (however much it is unstated). As Einstein put it “your theory determines the measurement you make.”  Pan, et al. were testing the hypothesis that red meat increases mortality.  If they had done the right analysis, they would have admitted that the test had failed and the hypothesis was not true.  The association was very weak and the underlying mechanism was, in fact, not borne out.  In some sense, in science, there is only association. God does not whisper in our ear that the electron is charged. We make an association between an electron source and the response of a detector.  Association does not necessarily imply causality, however; the association has to be strong and the underlying mechanism that made us make the association in the first place, must make sense.

What is the mechanism that would make you think that red meat increased mortality.  One of the most remarkable statements in the original paper:

“Regarding CVD mortality, we previously reported that red meat intake was associated with an increased risk of coronary heart disease2, 14 and saturated fat and cholesterol from red meat may partially explain this association.  The association between red meat and CVD mortality was moderately attenuated after further adjustment for saturated fat and cholesterol, suggesting a mediating role for these nutrients.” (my italics)

This bizarre statement — that saturated fat played a role in increased risk because it reduced risk— was morphed in the Harvard News Letters plea bargain to “The authors of the Archives paper suggest that the increased risk from red meat may come from the saturated fat, cholesterol, and iron it delivers;” the blogger forgot to add “…although the data show the opposite.” Reference (2) cited above had the conclusion that “Consumption of processed meats, but not red meats, is associated with higher incidence of CHD and diabetes mellitus.” In essence, the hypothesis is not falsifiable — any association at all will be accepted as proof. The conclusion may be accepted if you do not look at the data.

The Data

In fact, the data are not available. The individual points for each people’s red meat intake are grouped together in quintiles ( broken up into five groups) so that it is not clear what the individual variation is and therefore what your real expectation of actually living longer with less meat is.  Quintiles are some kind of anachronism presumably from a period when computers were expensive and it was hard to print out all the data (or, sometimes, a representative sample).  If the data were really shown, it would be possible to recognize that it had a shotgun quality, that the results were all over the place and that whatever the statistical correlation, it is unlikely to be meaningful in any real world sense.  But you can’t even see the quintiles, at least not the raw data. The outcome is corrected for all kinds of things, smoking, age, etc.  This might actually be a conservative approach — the raw data might show more risk — but only the computer knows for sure.

Confounders

“…mathematically, though, there is no distinction between confounding and explanatory variables.”

  — Walter Willett, Nutritional Epidemiology, 2o edition.

You make a lot of assumptions when you carry out a “multivariate adjustment for major lifestyle and dietary risk factors.”   Right off , you assume that the parameter that you want to look at — in this case, red meat — is the one that everybody wants to look at, and that other factors can be subtracted out. However, the process of adjustment is symmetrical: a study of the risk of red meat corrected for smoking might alternatively be described as a study of the risk from smoking corrected for the effect of red meat. Given that smoking is an established risk factor, it is unlikely that the odds ratio for meat is even in the same ballpark as what would be found for smoking. The figure below shows how risk factors follow the quintiles of meat consumption.  If the quintiles had been derived from the factors themselves we would have expected even better association with mortality.

The key assumption is that the there are many independent risk factors which contribute in a linear way but, in fact, if they interact, the assumption is not appropriate.  You can correct for “current smoker,” but biologically speaking, you cannot correct for the effect of smoking on an increased response to otherwise harmless elements in meat, if there actually were any.  And, as pointed out before, red meat on a sandwich may be different from red meat on a bed of cauliflower puree.

This is the essence of it.  The underlying philosophy of this type of analysis is “you are what you eat.” The major challenge to this idea is that carbohydrates, in particular, control the response to other nutrients but, in the face of the plea of nolo contendere,  it is all moot.

Who paid for this and what should be done.

We paid for it. Pan, et al was funded in part by 6 NIH grants.  (No wonder there is no money for studies of carbohydrate restriction).  It is hard to believe with all the flaws pointed out here and, in the end, admitted by the Harvard Health Blog and others, that this was subject to any meaningful peer review.  A plea of no contest does not imply negligence or intent to do harm but something is wrong. The clear attempt to influence the dietary habits of the population is not justified by an absolute risk reduction of less than one-tenth of one per cent, especially given that others have made the case that some part of the population, particularly the elderly may not get adequate protein. The need for an oversight committee of impartial scientists is the most important conclusion of Pan, et al.  I will suggest it to the NIH.

(Answers to last week’s organic puzzler at the end of this post).

One of the more remarkable results from Jeff Volek’s laboratory in the past few years was the demonstration that when the blood of volunteers was assayed for saturated fatty acids (SFA), those subjects who had been on a very low-carbohydrate diet had lower levels than those on an isocaloric low-fat diet. This, despite the fact that the low-carbohydrate diet had three times the amount of saturated fat as the low-fat diet. How is this possible? What happened to the saturated fat in the low-carbohydrate diet? Well, that’s what metabolism does. The saturated fat in the low-carbohydrate arm was oxidized while (the real impact of the study) the low-fat arm is making new saturated fatty acid. Volek’s former student Cassandra Forsythe extended the idea by showing how, even under eucaloric conditions (no weight loss) dietary fat has relatively small impact on plasma fat.

The essential point of what I now call the Volek-Westman principle — we should be speaking of basic principles because the idea is more important than specific diets where it is impossible to get any agreement on definitions — the principle is that carbohydrate, directly or indirectly through insulin and other hormones, controls what happens to ingested (or stored) fatty acids. The motto of the Nutrition & Metabolism Society is: “A high fat diet in the presence of carbohydrate is different than a high fat diet in the presence of low carbohydrate.” Widely attributed to me, it is almost certainly something I once said although it has been said by others and the studies from Volek’s lab give you the most telling evidence.

The question is critical. Whereas the scientific evidence now establishes that dietary saturated fat has no effect on cardiovascular disease, obesity or anything else, plasma saturated fatty acids can be a cellular signal and if you study the effect of dietary saturated fatty acids under conditions where carbohydrate is high and/or in rodents where plasma fat better correlates with dietary fat, then you will confuse plasma fat with dietary fat. An important study identified potential cellular elements in control of gene transcription that bear on lipid metabolism.

So, it is important to know about plasma saturated fatty acids. First, recall that strictly speaking there are only saturated fatty acids (SFA) — this is explained in detail in an earlier post.  What is called saturated fats simply mean those fats that have a high percentage of SFAs — things that we identify as “saturated fats,” like butter, are usually only 50 % saturated fatty acids (coconut oil is probably the only fat that is almost entirely saturated fatty acids but because they are medium chain length, they are usually considered a special case).

In Volek’s study, 40 overweight subjects were randomly assigned either to a carbohydrate-restricted diet (abbreviated CRD; %CHO:fat:protein = 12:59:28) or to a low fat diet, (LFD; %CHO:fat:protein = 56:24:20). The group was unusual in that they were all overweight would be characterized as having metabolic syndrome, in particular they all had, atherogenic dyslipidemia, which is the term given to a poor lipid profile (high triacylglycerol (TAG), low HDL-C, high small-dense LDL (so-called pattern B)). Metabolic syndrome (MetS) is the predisposition to CVD and diabetes and is characterized by the constellation of overweight, atherogenic dyslipidemia and, by now, a dozen other markers.

The paper is one of the more striking for the differences in weight loss between two diet regimens. Although participants were not specifically counseled to reduce calories, there was a reduction in total caloric intake in both two groups. The response in weight loss, however, due to the difference in macronutrient composition, was dramatically different in the two groups. The CRD group (labelled as very low carbohydrate ketogenic diet (VLCKD) in the figure) lost twice as much weight on average as the low-fat controls despite the similar caloric intake. Although there was substantial individual variation, 9 of 20 subjects in the CRD (VLCKD) group lost 10% of their starting weight. more than that lost by any of the subjects in the LFD group. In fact, nobody following the LFD lost as much weight as the average for the low-carbohydrate group and, unlike George Bray’s demonstration of caloric inefficiency, whole body fat mass was where the major differences between the CRD (VLCKD) and LF appeared (5.7 kg vs 3.7 kg). Of significance is the observation that fat mass in the abdominal region decreased more in subjects on the CRD than in subjects following the LFD (-828 g vs -506 g). This is one of the more dramatic effects of carbohydrate restriction on weight loss but many have preceded it and these have been frequently criticized for increasing the amount of saturated fat (whether or not any particular study actually increased saturated fat). Although the original “concern” was that this would lead to increased plasma cholesterol, eventually saturated fat became a generalized villain and, insofar as any science was involved, the effects of plasma saturated fat were assumed to be due to dietary saturated fat. The outcome of Volek’s study was surprising. Surprising because the effect was so clear cut (no statistics needed) and because an underlying mechanism could explain the results.

Saturated Fat

The dietary intake of saturated fat for the people on the VLCKD (36 g/day) was threefold higher than that of the people on the LFD (12 g/day). When the relative proportions of circulating SFAs in the triglyceride and cholesterol ester fractions were determined, they were actually lower in the low carb group. Seventeen of 20 subjects on the CRD (VLCKD) showed a decrease in total saturates (the others had low values at baseline) in comparison to half of the subjects consuming the LFD had a decrease in saturates. When the absolute fasting TAG levels are taken into account (low carbohydrate diets reliably reduce TAB=G), the absolute concentration of total saturates in plasma TAG was reduced by 57% in the low carbohydrate arm compared to 24% reduction in the low fat arm who had, in fact, reduced their saturated fat intake. One of the saturated fatty acids of greatest interest was palmitic acid or, in chemical short-hand, 16:0 (16 means that there are 16 carbons and 0 means there are no double bonds, that is, no unsaturation).

So how could this happen? The low fat group reduced their SFA intake by one-third, yet had more SFA in their blood than the low-carbohydrate group who had actually increased intake. Well, we need to look at the next thing in metabolism.

In the post on An Introduction to Metabolism, we made the generalization that there were roughly two kinds of fuel, glucose and acetyl-CoA (the two carbon derivative of acetic acid). The big principle in metabolism was that you could make acetyl-CoA from glucose, but (with some exceptions) you couldn’t make glucose from acetyl-CoA, or more generally, you can make fat from glucose but you can’t make glucose from fat. How do you make fat from glucose? Part of the picture is making new fatty acids, the process known as De Novo Lipogenesis (DNL) or more accurately de novo fatty acid synthesis. The mechanism then involves successively patching together two carbon acetyl-CoA units until you reach the chain length of 16 carbons, palmitic acid. The first step is formation of a three carbon compound, malonyl-CoA, a process which is under the control of insulin. Malonyl-CoA starts the process of DNL but simultaneously prevents oxidation of any fatty acid since, if you are making it, you don’t want to burn it. This can be further processed, among other things, can be elongated to stearic acid (18:0). So this is a reasonable explanation for the increased saturated fatty acid in the low-fat group: the higher carbohydrate diet has higher insulin levels on average, encouraging diversion of calories into fatty acid synthesis and repressing oxidation. How could this be tested?

It turns out that, in addition to elongation, the palmitic acid can be desaturated to make the unsaturated fatty acid, palmitoleic acid (16:1-n7, 16 carbons, one unsaturation at carbon 7) and the same enzyme that catalyzes this reaction will convert stearic acid (18:0) to the unsaturated fatty acid oleic acid (18:1n-7). The enzyme is named for the second reaction stearoyl desaturase-1 (SCD-1; medical students always hate seeing a “-1” since they know 2 and 3 may will have to be learned although, in this case, they are less important). SCD-1 is a membrane-bound enzyme and it seems that it is not swimming around the cell looking for fatty acids but is, rather, closely tied to DNL, that is, it preferentially de-saturates newly formed palmitic acid to palmitoleic acid.

There is very little palmitoleic acid in the diet so its presence in the blood is an indication of SCD-1 activity. The data show a 31% decrease in palmitoleic acid (16:1n-7) in the blood of subjects on the low-carb arm with little overall change in the average response in the low fat group. Saturated fat, in your blood or on your plate?

Forsythe’s paper extended the work by putting men on two different weight-maintaining low-carbohydrate diets for 6 weeks. One of the diets was designed to be high in SFA (high in dairy fat and eggs), and the other, was designed to be higher in unsaturated fat from both polyunsaturated (PUFA) and monounsaturated (MUFA) fatty acids (high in fish, nuts, omega-3 enriched eggs, and olive oil). The relative percentages of SFA:MUFA: PUFA were, for the SFA-carbohydrate-restricted diet, 31: 21:5, and for the UFA diet, 17:25:15. The results showed that the major changes in plasma SFA and MUFA were in the plasma TAG fraction although probably much less than might be expected given the nearly two-fold difference in dietary saturated fat and, as the authors point out: “the most striking finding was the lack of association between dietary SFA intake and plasma SFA concentrations.”

So although it is widely said that the type of fat is more important than the amount, the type is not particularly important. But, what about the amount? A widely cited paper by Raatz, et al. suggested, as indicated by the title, that ‘‘Total fat intake modifies plasma fatty acid composition in humans”, but the data in the paper shows that differences between high fat and low fat were in fact minimal (figure below).

The bottom line is that distribution of types of fatty acid in plasma is more dependent on the level of carbohydrate then the level or type of fat. Volek and Forsythe give you a good reason to focus on the carbohydrate content of your diet. What about the type of carbohydrate? In other words, is glycemic index important? Is fructose as bad as they say? We will look at that in a future post in which I will conclude that no change in the type of carbohydrate will ever have the same kind of effect as replacing carbohydrate across the board with fat. I’ll prove it.

====================================================================

Answers to the organic quiz.