Posts Tagged ‘biochemistry’


One of my favorite legal terms, collateral estoppel, refers to procedures to prevent re-litigation of issues that have already been settled in court. From the same root as stopper, that is, cork, it prevents harassment and wasting of the court’s time. The context is the recent flap over a poster presented by Kevin Hall which has started re-trying the case of whether all diets have the same metabolic efficiency, a question which, in my view, has been adjudicated several times. I put it this way because frequently I have made an analogy between evidence-based-medicine (EBM) and evidence as presented in a court of law. My main point has been that, in the legal system, there are rules of evidence and there is a judge who decides on admissibility. You can’t just say, as in EBM, that your stuff constitutes evidence.  My conclusion is usually that EBM is one of the self-congratulatory procedures that allows people to say anything that they want without having to defend their position. EBM represents one of the many corruptions of research procedure now under attack by critics (perpetrators ?) as in the recent editorial by Richard Horton, editor of The Lancet. One thing that I  criticize medical nutrition for is its inability to be estopped from funding and endlessly re-investigating whether saturated fat causes heart disease, whether high protein diets hurt your kidneys, and whether a calorie is a calorie. It seems that the issue is more or less settled — there are dozens of examples of variable energy expenditure in the literature. It would be reasonable to move on by investigating the factors that control energy balance, to provide information on the mechanisms that predict great variability and, most important, the mechanisms that make it so small in biological systems — most of the time, a calorie is a calorie, at least roughly. Funding and performing ever more expensive experiments to decide whether you can lose more or less weight on one diet or another, as if we had never done a test before, is not helpful.

Several bloggers discussed Hall’s study which claims that either a calorie is a calorie or it is not depending on whether, as described by Mike Eades, you look at the poster itself or at a video of Kevin Hall explaining what it is about. Mike’s blog is excellent but beyond the sense of déja-vu, the whole thing reminded me of the old joke about the Polish mafia. They make you an offer that you can’t understand.  So, because this is how I got into this business, I will try to explain how I see the problem of energy balance and why we might want this trial estopped.

I have taught nutrition and metabolism for many years but I got into nutrition research because the laws of thermodynamics were, and still are, invoked frequently in the discussion. Like most chemists, I wouldn’t claim to be a real expert but I like the subject and I teach the subject at some level. I could at least see that nobody in nutrition knew what they were talking about. I tried to show that the application of thermodynamics, if done correctly, more or less predicts that different diets will have different efficiencies (from the standpoint of storage, that is, weight gained per calorie consumed).

But you don’t really need thermodynamics to see this. Prof. Wendy Pogozelski at SUNY Geneseo pointed out that if you think about oxidative metabolic uncouplers, that is all you need to know. “Coupling,” in energy metabolism, refers to the sequence of reactions by which the energy from the oxidation of food is converted to ATP, that is, into useful biologic energy. The problem in energy metabolism is that the fuel, as in many “combustion engines,” is processed by oxidation — you put in oxygen and get out CO2 and water . The output, on the other hand  is a phosphorylation reaction — generation of ATP from ADP, its low energy form. The problem is how to couple these two different kins of reactions. It turns out that the mitochondrial membrane couples the two processes (together called oxidative phosphorylation). A “high energy” state is established across the membrane by oxidation and this energy is used to make ATP. Uncouplers are small molecules or proteins that disengage the oxidation of substrate (food) from ATP synthesis allowing energy to be wasted or channeled into other mechanisms, generation of reactive oxygen species, for example.

BLOG_car_analogy_May_16The car analogy of metabolic inhibitors. Figure from my lectures. Energy is generated in the TCA cycle and electron transport chain (ETC). The clutch plays the role of the membrane proton gradient, transmitting energy to the wheels which produce forward motion (phosphorylation of ADP). Uncouplers allow oxidation to continue — the TCA cycle is “racing” but to no effect. Other inhibitors (called oxidative phosphorylation inhibitors) include oligomycin which blocks the ATP synthase, analogous to a block under the wheels: no phosphorylation, no utilization of the gradient; no utilization, no gradient formation; no gradient, no oxidation. The engine “stalls.”

In teaching metabolism, I usually use the analogy of an automobile where the clutch connects the engine to the drive train . The German word for clutch is Kupplung and when you put a car in neutral your car is uncoupled, can process many calories of gasoline ‘in,’ but has zero efficiency, so that none of the ‘out’ does the useful work of turning the wheels. Biological systems can be uncoupled by external compounds — the classic is 2, 4-dinitrophenol which, if you are familiar with mitochondrial metabolism, is a proton ionophore, that is, destroys the proton gradient that couples oxidation to ADP-phophorylation.  There are natural uncouplers, the uncoupling proteins, of which there are five, named UCP-1 through UCP-5. Considered a family because of the homology to UCP-1, a known uncoupler, it has turned out that at least two others clearly have uncoupling activity. The take-home message is that whatever the calories in, the useful calories out (for fat storage or whatever) depends on the presence of added or naturally occurring uncouplers as well.

This is one of many examples of the mechanisms whereby metabolic calories-out per calorie-in could be variable.  The implication is that when somebody reports metabolic advantage (or disadvantage), there is no reason to disbelieve it. Conversely, this is one of the mechanisms that can reduce variability.

In fact, homeostatic mechanisms  are usually observed. You don’t have to have a metabolic chamber to know that your intake is variable day-to-day but your weight may be quite stable. The explanation is not in the physics which, again,  predicts variation, but rather in the biological system which is always connected in feedback so as to resist change. However strong the homeostasis (maintenance of steady-state), conversely, everybody has the experience of being in a situation where it doesn’t happen. “I don’t understand. I went on this cruise and I really pigged out on lobster and steak but I didn’t gain any weight.”  (It is not excluded, but nobody ever says that about the pancake breakfast). In other words, biochemistry and daily experience tells us that black swans are to be expected and, given that the system is set up for variability, the real question is why there are so many white swans.

So it is physically predicted that a calorie is not a calorie. When it has been demonstrated, in animal models where there is control of the food intake, or in humans, where there are frequently big differences that cannot reasonably be accounted for by the error in food records, there is no reason to doubt the effect. And, of course, a black swan is an individual. Kevin Hall’s study, as in much of the medical literature, reported group statistics and we don’t know if there were a few winners in with the group. The work has not been reviewed or published but, either way, I think it is likely to waste the court’s time.
 

Guest post: Dr. Eugene J. Fine

Last time I discussed our pilot study showing the effects of carbohydrate (CHO) restriction & insulin inhibition (INSINH) in patients with advanced cancers.  We described how the molecular effects of INSINH plus systemic (total body) effects like ketosis might inhibit cancer growth. My goal now is to present the underlying hypothesis behind the idea with the goal of understanding how patients with cancers might respond if we inhibited insulin’s actions? Should all patients respond? If not, why not? Might some patients get worse? These ideas were described briefly in our publication describing our pilot protocol. (more…)

In the last post, I had proclaimed a victory for dietary carbohydrate restriction or, more precisely, recognition of its explicit connection with cell signaling. I had anointed the BMC Washington meeting as the historic site for this grand synthesis. It may have been a matter of perception — many researchers in carbohydrate restriction entered the field precisely because it came from the basic biochemistry where the idea was that the key player was the hormone insulin and glucose was the major stimulus for pancreatic secretion of insulin. We had largely ignored the hook-up with cell-biology because of the emphasis on calorie restriction, and it may have only needed getting everybody in the same room to see that the role of insulin in cancer was not separate from its role in carbohydrate restriction. (more…)

It was in July of 2012 that I suddenly realized that we had won, at least scientifically. It was now clear that we had a consistent set of scientific ideas that supported the importance of insulin signaling in basic biochemistry and cell biology and that there was a continuum with the role of dietary carbohydrate restriction in obesity, diabetes or for general health.  The practical considerations, how much to eat of this, how much to eat of that, were still problematical but now we had the kernel of a scientific principle. In fact, it was not so much that we had the answer as that we had the right question.  In science, the question is frequently more important than the answer.  Of course, winning wasn’t the original idea. When my colleagues and I got into this, about ten years ago, coming from basic biochemistry, we hadn’t anticipated that it would be such a battle, that there would be so much resistance to what we thought was normal scientific practice.

(more…)

(Answers to last week’s organic puzzler at the end of this post).

One of the more remarkable results from Jeff Volek’s laboratory in the past few years was the demonstration that when the blood of volunteers was assayed for saturated fatty acids (SFA), those subjects who had been on a very low-carbohydrate diet had lower levels than those on an isocaloric low-fat diet. This, despite the fact that the low-carbohydrate diet had three times the amount of saturated fat as the low-fat diet. How is this possible? What happened to the saturated fat in the low-carbohydrate diet? Well, that’s what metabolism does. The saturated fat in the low-carbohydrate arm was oxidized while (the real impact of the study) the low-fat arm is making new saturated fatty acid. Volek’s former student Cassandra Forsythe extended the idea by showing how, even under eucaloric conditions (no weight loss) dietary fat has relatively small impact on plasma fat.

The essential point of what I now call the Volek-Westman principle — we should be speaking of basic principles because the idea is more important than specific diets where it is impossible to get any agreement on definitions — the principle is that carbohydrate, directly or indirectly through insulin and other hormones, controls what happens to ingested (or stored) fatty acids. The motto of the Nutrition & Metabolism Society is: “A high fat diet in the presence of carbohydrate is different than a high fat diet in the presence of low carbohydrate.” Widely attributed to me, it is almost certainly something I once said although it has been said by others and the studies from Volek’s lab give you the most telling evidence.

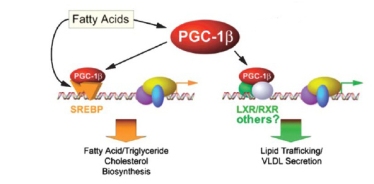
The question is critical. Whereas the scientific evidence now establishes that dietary saturated fat has no effect on cardiovascular disease, obesity or anything else, plasma saturated fatty acids can be a cellular signal and if you study the effect of dietary saturated fatty acids under conditions where carbohydrate is high and/or in rodents where plasma fat better correlates with dietary fat, then you will confuse plasma fat with dietary fat. An important study identified potential cellular elements in control of gene transcription that bear on lipid metabolism.

So, it is important to know about plasma saturated fatty acids. First, recall that strictly speaking there are only saturated fatty acids (SFA) — this is explained in detail in an earlier post.  What is called saturated fats simply mean those fats that have a high percentage of SFAs — things that we identify as “saturated fats,” like butter, are usually only 50 % saturated fatty acids (coconut oil is probably the only fat that is almost entirely saturated fatty acids but because they are medium chain length, they are usually considered a special case).

In Volek’s study, 40 overweight subjects were randomly assigned either to a carbohydrate-restricted diet (abbreviated CRD; %CHO:fat:protein = 12:59:28) or to a low fat diet, (LFD; %CHO:fat:protein = 56:24:20). The group was unusual in that they were all overweight would be characterized as having metabolic syndrome, in particular they all had, atherogenic dyslipidemia, which is the term given to a poor lipid profile (high triacylglycerol (TAG), low HDL-C, high small-dense LDL (so-called pattern B)). Metabolic syndrome (MetS) is the predisposition to CVD and diabetes and is characterized by the constellation of overweight, atherogenic dyslipidemia and, by now, a dozen other markers.

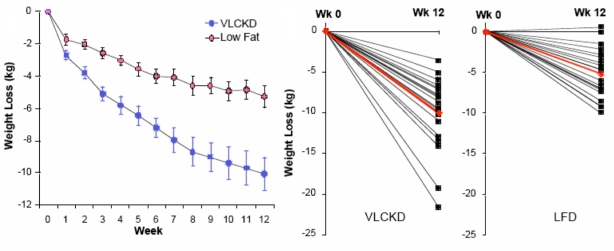
The paper is one of the more striking for the differences in weight loss between two diet regimens. Although participants were not specifically counseled to reduce calories, there was a reduction in total caloric intake in both two groups. The response in weight loss, however, due to the difference in macronutrient composition, was dramatically different in the two groups. The CRD group (labelled as very low carbohydrate ketogenic diet (VLCKD) in the figure) lost twice as much weight on average as the low-fat controls despite the similar caloric intake. Although there was substantial individual variation, 9 of 20 subjects in the CRD (VLCKD) group lost 10% of their starting weight. more than that lost by any of the subjects in the LFD group. In fact, nobody following the LFD lost as much weight as the average for the low-carbohydrate group and, unlike George Bray’s demonstration of caloric inefficiency, whole body fat mass was where the major differences between the CRD (VLCKD) and LF appeared (5.7 kg vs 3.7 kg). Of significance is the observation that fat mass in the abdominal region decreased more in subjects on the CRD than in subjects following the LFD (-828 g vs -506 g). This is one of the more dramatic effects of carbohydrate restriction on weight loss but many have preceded it and these have been frequently criticized for increasing the amount of saturated fat (whether or not any particular study actually increased saturated fat). Although the original “concern” was that this would lead to increased plasma cholesterol, eventually saturated fat became a generalized villain and, insofar as any science was involved, the effects of plasma saturated fat were assumed to be due to dietary saturated fat. The outcome of Volek’s study was surprising. Surprising because the effect was so clear cut (no statistics needed) and because an underlying mechanism could explain the results.

Saturated Fat

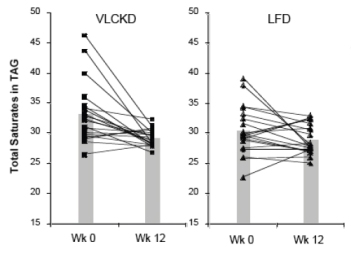
The dietary intake of saturated fat for the people on the VLCKD (36 g/day) was threefold higher than that of the people on the LFD (12 g/day). When the relative proportions of circulating SFAs in the triglyceride and cholesterol ester fractions were determined, they were actually lower in the low carb group. Seventeen of 20 subjects on the CRD (VLCKD) showed a decrease in total saturates (the others had low values at baseline) in comparison to half of the subjects consuming the LFD had a decrease in saturates. When the absolute fasting TAG levels are taken into account (low carbohydrate diets reliably reduce TAB=G), the absolute concentration of total saturates in plasma TAG was reduced by 57% in the low carbohydrate arm compared to 24% reduction in the low fat arm who had, in fact, reduced their saturated fat intake. One of the saturated fatty acids of greatest interest was palmitic acid or, in chemical short-hand, 16:0 (16 means that there are 16 carbons and 0 means there are no double bonds, that is, no unsaturation).

So how could this happen? The low fat group reduced their SFA intake by one-third, yet had more SFA in their blood than the low-carbohydrate group who had actually increased intake. Well, we need to look at the next thing in metabolism.

In the post on An Introduction to Metabolism, we made the generalization that there were roughly two kinds of fuel, glucose and acetyl-CoA (the two carbon derivative of acetic acid). The big principle in metabolism was that you could make acetyl-CoA from glucose, but (with some exceptions) you couldn’t make glucose from acetyl-CoA, or more generally, you can make fat from glucose but you can’t make glucose from fat. How do you make fat from glucose? Part of the picture is making new fatty acids, the process known as De Novo Lipogenesis (DNL) or more accurately de novo fatty acid synthesis. The mechanism then involves successively patching together two carbon acetyl-CoA units until you reach the chain length of 16 carbons, palmitic acid. The first step is formation of a three carbon compound, malonyl-CoA, a process which is under the control of insulin. Malonyl-CoA starts the process of DNL but simultaneously prevents oxidation of any fatty acid since, if you are making it, you don’t want to burn it. This can be further processed, among other things, can be elongated to stearic acid (18:0). So this is a reasonable explanation for the increased saturated fatty acid in the low-fat group: the higher carbohydrate diet has higher insulin levels on average, encouraging diversion of calories into fatty acid synthesis and repressing oxidation. How could this be tested?

It turns out that, in addition to elongation, the palmitic acid can be desaturated to make the unsaturated fatty acid, palmitoleic acid (16:1-n7, 16 carbons, one unsaturation at carbon 7) and the same enzyme that catalyzes this reaction will convert stearic acid (18:0) to the unsaturated fatty acid oleic acid (18:1n-7). The enzyme is named for the second reaction stearoyl desaturase-1 (SCD-1; medical students always hate seeing a “-1” since they know 2 and 3 may will have to be learned although, in this case, they are less important). SCD-1 is a membrane-bound enzyme and it seems that it is not swimming around the cell looking for fatty acids but is, rather, closely tied to DNL, that is, it preferentially de-saturates newly formed palmitic acid to palmitoleic acid.

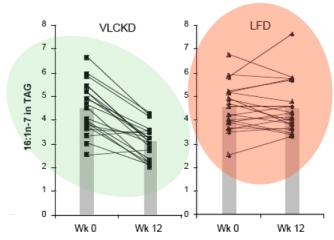
There is very little palmitoleic acid in the diet so its presence in the blood is an indication of SCD-1 activity. The data show a 31% decrease in palmitoleic acid (16:1n-7) in the blood of subjects on the low-carb arm with little overall change in the average response in the low fat group. Saturated fat, in your blood or on your plate?

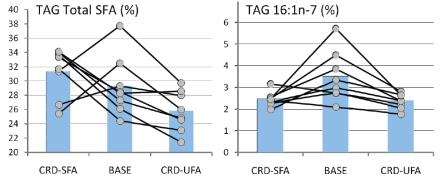
Forsythe’s paper extended the work by putting men on two different weight-maintaining low-carbohydrate diets for 6 weeks. One of the diets was designed to be high in SFA (high in dairy fat and eggs), and the other, was designed to be higher in unsaturated fat from both polyunsaturated (PUFA) and monounsaturated (MUFA) fatty acids (high in fish, nuts, omega-3 enriched eggs, and olive oil). The relative percentages of SFA:MUFA: PUFA were, for the SFA-carbohydrate-restricted diet, 31: 21:5, and for the UFA diet, 17:25:15. The results showed that the major changes in plasma SFA and MUFA were in the plasma TAG fraction although probably much less than might be expected given the nearly two-fold difference in dietary saturated fat and, as the authors point out: “the most striking finding was the lack of association between dietary SFA intake and plasma SFA concentrations.”

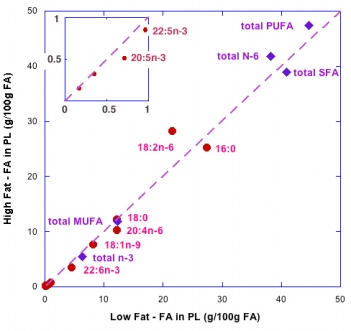
So although it is widely said that the type of fat is more important than the amount, the type is not particularly important. But, what about the amount? A widely cited paper by Raatz, et al. suggested, as indicated by the title, that ‘‘Total fat intake modifies plasma fatty acid composition in humans”, but the data in the paper shows that differences between high fat and low fat were in fact minimal (figure below).

The bottom line is that distribution of types of fatty acid in plasma is more dependent on the level of carbohydrate then the level or type of fat. Volek and Forsythe give you a good reason to focus on the carbohydrate content of your diet. What about the type of carbohydrate? In other words, is glycemic index important? Is fructose as bad as they say? We will look at that in a future post in which I will conclude that no change in the type of carbohydrate will ever have the same kind of effect as replacing carbohydrate across the board with fat. I’ll prove it.

====================================================================

Answers to the organic quiz.

I am currently teaching nutrition and metabolism to first year medical students.  The problem in this subject is the large number of individual reactions which leads students to think of the subject the way somebody described the study of history: just one damned thing after another.  I try to present the big picture and the approach is the systems or “black box”  strategy.  The method is to ask whether we can get some information just by looking at the inputs and outputs to a system even if we don’t know any of the details of what’s going on inside.  In other words, it is a way of organizing limited information.  The method is favored by engineers who are the people most unhappy with the idea that they don’t know anything at all.  First, the big principles.

Metabolism: two goals, two fuels.  

There are two major goals in human energy metabolism: First, to provide energy for life processes in the form of the molecule ATP and second, to provide glucose for those cells that require glucose (particularly brain and central nervous system) and to maintain blood glucose at a relatively constant level: too little is obviously not good but too much is also a problem in that glucose is chemically reactive and can interact with body material, particularly proteins when at high concentrations. Of course, metabolism does many things but these are the two major goals in providing energy.

A second big generalization is that in this process there two kinds of fuels: glucose and acetyl-Coenzyme A (abbreviated acetyl-CoA or sometimes written as acetyl-SCoA; the S, which is meant to show that the compound contains sulfur, is not pronounced).

The black box of life. 

You knew what we do in metabolism even before you started reading this. Putting it into black box terms, you knew: we take in food and we take in oxygen. We excrete CO2 and water.  Somehow this gives us the energy for life as well as the material to build up components of the body.  You don’t have to know too much chemistry to figure out the important conclusion that, inside the black box, living systems use oxidation, just like combustion in a furnace. Lavoisier’s whole animal calorimeter that I described in a previous post was a beautiful real demonstration of this black box.  More technically, this is an oxidation-reduction reaction.  Oxidation, in a biochemical context, means combination with oxygen or loss of hydrogen and reduction means loss of oxygen or gain of hydrogen; we say that the (carbons in the) food gets oxidized and the oxygen gets reduced (to water).  Like the common oxidation reactions you know (combustion in a furnace or an automobile engine), this produces energy which can be used to do work. Some work is mechanical work — moving muscles — but most of the energy is used for chemical: work making body material and keeping biological structures intact and generally keeping things running.  The medium of energy in metabolism is the chemical reaction of synthesis and breakdown of the molecule ATP.  Textbooks frequently refer to ATP as a “high energy molecule” but it is not the compound itself but rather the reaction (synthesis and breakdown (hydrolysis)) that is high energy.  For the moment, we can think of ATP as the “coin of energy exchange in metabolism.”  A heavy-duty thought concept: the challenge for biochemistry historically was to explain how the energy from an oxidation-reduction reaction could be used to carry out the synthesis of ATP which has a different mechanism (phosphate transfer).  The process is called oxidative phosphorylation and was only figured out about fifty years ago.

So again, our two goals in human metabolism: Make energy in the form of ATP and maintain a pretty much constant level of blood glucose for those cells, brain and central nervous system, that require glucose (the brain can’t use fatty acids as a fuel).

Let’s look at energy production first because it is a little easier to understand.  As we look inside the black box, each of the processes uncovered will have its own degree of complexity.  In reading this you have to do what scientists do: hang in there.  Skip over the parts that seem complex and see if you can come back to them later.

The role of redox coenzymes

So, breaking into the black box, the first thing to notice is that the oxidation of food is done in steps, and that there is another player that mediates the process by coupling separate pieces: the food never sees the oxygen.  The intermediaries are called coenzymes or cofactors.  The most important oxidative coenzyme is known as NAD.  It’s always referred to by the acronym, but if you’ve had some organic chemistry and you’re curious, NAD stands for nicotinamide-adenine-dinucleotide; the structure is shown in the figure and the action end of the molecule is indicated. NAD coenzymes are derived from the vitamin niacin.  So   what happens in metabolism is that food is oxidized by NAD+ (the oxidized form of NAD) and the product, NADH (the reduced form) is re-oxidized by molecular oxygen. Although it is still just as we thought (food+oxygen-in, CO2+water-out), the oxygen never sees the food.   Why do we do it this way?  If we did it all in one big blast like an automobile engine, we would have little control over it and we would not be able to capture the energy in a usable chemical form.

It’s easiest to start with glucose, a six-carbon compound. The early steps in metabolism involve a process known as glycolysis (sugar splitting) that ultimately gives you two molecules of a three-carbon compounds known as pyruvic acid. Pyruvic acid is oxidized to a derivative of acetic acid, known as acetyl-CoA. The CoA is short for Coenzyme A, a complicated molecule but, like many coenzymes is always referred to in this way so it is not important to know the detailed structure.  The compound is frequently written acetyl-SCoA to emphasize that it is a thioester (sulfur ester); again, the “S” is not pronounced.

Acetyl-SCoA is the fuel for the major NADH-producing process, known as the Krebs cycle after the major player in its discovery. Without looking into that black box too much the key compound is citric acid, which is, chemically a try-carboxylic acid (TCA) so the Krebs cycle is also called the citric acid cycle or TCA cycle; Krebs called it the TCA cycle so I will generally use that term.  The process whereby NADH is finally re-oxidized by oxygen is known as electron transport.  So, The big black boxes of metabolism:

Where do we get Glucose and Acetyl-CoA?

So far we know: most energy comes from the oxidation of acetyl-CoA and most of the glucose that provides energy does so by first being converted to acetyl-CoA. Where else can we get acetyl-CoA? We’ve taken glucose as synonymous with food but where else can we get glucose from besides the diet?

Looking ahead, the big results that will come out of opening up the black box of metabolism: 1) Acetyl-CoA also comes from fat and to a smaller extent from protein.  2) Glucose can also be formed from protein. 3) Under conditions where there is no dietary glucose (starvation, low carbohydrate diet), glucose will be made from protein or released from stored glycogen, and an alternative fuel ketone bodies will provide acetyl-CoA; ketone bodies are essentially a dimer of acetyl-CoAs and the liver makes and exports ketone bodies to other cells.  Acetyl-CoA and, therefore, glucose can be converted to fat but a major asymmetry that will have profound significance is that 4) glucose cannot be formed from acetyl-CoA.  The significance of the last statement is that: we know all too well that fat can be formed from glucose but, with minor exceptions, 5) glucose cannot be formed from fat. (Chris Masterjohn’s post “We Really Can Make Glucose From Fatty Acids After All!”
indicates the extent to which the exceptions become important but the overriding principle that has the most impact on metabolism is that you cannot make glucose from fat).
So that’s it.  You now have a blackbox view of metabolism.  I will try to open some of the boxes in future posts.

Summary of fuel sources and synthesis and looking ahead.

  1. There are, roughly speaking, two kinds of fuels: glucose and acetyl-CoA.
  2. Carbohydrates and other nutrients, fat (that is, fatty acids) and protein (amino acids) can supply acetyl-CoA.  Glucose is not required for acetyl-CoA and under conditions of low carbohydrate or low total food, fatty acids become the major source of acetyl-CoA.
  3. Not all tissues can use all fuel sources. Brain, CNS and red blood cells, for example cannot use fatty acids. Brain and CNS can use acetyl-CoA but cannot get it from fatty acids.  Red blood cells only use glucose and, to a first approximation, brain and CNS are also dependent on glucose for metabolism.
  4. Under conditions of starvation or carbohydrate restriction, acetyl-CoA can be effectively transported from the liver in the form of  ketone bodies. Ketone bodies, then, are a source of acetyl-CoA that can be used by brain and CNS.  Red blood cells are still dependent on glucose but the brain’s demand for glucose is reduced by the availability of ketone bodies.
  5. There is no dietary requirement for carbohydrate and amino acids can also supply glucose through the process of gluconeogenesis.
  6. Fat as a source of acetyl-CoA also works the other way: acetyl-CoA can be converted to fat.
  7. Whereas glucose can be converted to fat, with a few exceptions, fat cannot be converted to glucose. This will be a key idea behind carbohydrate restriction.
  8. Glucose can also be stored as the polymer glycogen.
  9. Bottom line is the limitation of “you are what you eat.” Metabolism means the interconversion of food and metabolites. Conversely, it will be critical that not everything is interconvertible. In particular, we will emphasize that you can make fat from carbohydrate but, to a large extent,  you cannot make glucose from fat.

Looking ahead on sources of blood glucose:

  1. Glucose from dietary input (referred to as the fed state; in nutrition, as the postprandial period), is depleted after about 8 hours.
  2. Glycogen is a storage/supply source of glucose.  Liver glycogen can supply export glucose to the blood, thereby supplying other tissues.  Muscle glycogen supplies glucose only for the muscle itself.  Glycogen may become largely depleted after 24 hours, depending on the conditions (exercise, for example).
  3. The third source of blood glucose is gluconeogenesis (GNG) which, as the name implies, makes glucose anew from existing metabolites. Depending on the conditions, the source of carbon may be amino acids, lactic acid or glycerol from fat metabolism.  Whereas it is sometimes indicated to be a “last ditch” source of glucose in the textbooks, it goes on all the time. The glucose it synthesizes in GNG may be used to replenish glycogen and only appear in the blood at a later time.

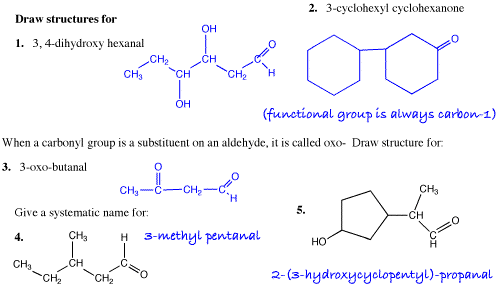
The last Organic-Biochemistry-Nutrition post presented the saturated hydrocarbons, which are familiar as gasolines and other fuels and oils.  The first step in getting control of organic chemistry is to be sure you can identify each compound which means recognizing (or assigning) a precise name.  From a theory standpoint, these compounds also provide the skeletons for nomenclature of the other classes of organic compounds.

The class of alcohols are those compounds that have a saturated carbon backbone and have one or more -OH groups attached.  The simplest alcohol is methanol CH3-OH.  Others are shown in the figure from the last post which emphasized that even if the backbone got very complicated, as in cholesterol, it was still an alcohol. The greater the percentage of the molecule that is -OH rather than hydrocarbon, the more they resemble water and the more they behave like water.  So, methanol, ethanol and propanol are soluble in water whereas butanol and higher alcohols are not.  Looking ahead, however, there are other chemical properties that are common to all alcohols: this is why it is so convenient to lump them together.

I received a comment on the last post that said “One wish, though: I don’t quite understand the graphic on cholesterol and how would that look when presented as the chemical symbols like all the other molecules in that last picture.”  I suggested the following exercise for understanding it by problem-solving. If you want to try this first, here is the exercise (answers follow):

  1. Draw the molecular formula for hexane.
  2. Connect the ends of the molecule by making a carbon-carbon bond.
  3. Recognize that now you have a hexagon-shaped objects all of whose vertices are CH-2. This molecule, not-surprisingly, is called cyclohexane.
  4. Since you know that all the points are CH-2, you can save time by just drawing the geometric figure.
  5. To make sure you have the idea, draw cyclopentane.
  6. Now draw a structure with two fused rings: two hexagons sharing a common side. This structure is called decalin (because it has ten carbons).
  7. Draw a C at each vertex or intersection. Now fill in hydrogens so that every carbon has four bonds. There should be 8 CH-2 and 2 CH.
  8. You can make a complex structure with three fused hexagons and one pentagon, as in the drawing. This structure is called cholestane and is the basis of the cholesterol in the drawing.
  9. If all this makes sense, Google “cholesterol structure” and click on “Image” in the top menu bar and you’ll see different representations.

The arrow is meant to show that the hexane molecule has no rigid structure and could be folded up. The relation to cyclohexane is formal, that is, pictorial.  (It is not that easy to convert one to the other in the laboratory). This has defined a new class of compounds, the cyclic hydrocarbons, that, rather than straight chains, are arranged in cyclic structures.  Before tackling questions 8 and 9, need to look at one more basic step.

Precise Names.

The allure of organic chemistry (to those who are attracted to it) is its precision and logic.  That’s why an important feature is the name game, giving precise names to organic compounds.  The idea is that if you order something from a chemical company, you want to know exactly what you are going to get.  Thinking about butanol, now, you might ask what you would call a compound that had exactly the same composition as butanol except that the -OH group was not at the end but rather attached to one of the other carbons.  To remove ambiguity in a case like this, the carbons are numbered. There are, in fact, two butanols: 1-butanol and 2-butanol.  There is no such thing as 3-butanol because, looking at the structures and remembering that we are trying to represent something from 3-D space, there is no difference between carbon-2 and carbon-3.

The big rule for numbering organic compounds: pick a numbering system that has the lowest numbers.  Even if, for some reason, the structure is written so that the hydroxyl group appears to be at the far end, you always pick the number so that is the lowest possible.  The next figure shows you some examples.  Make sure you are happy with this system.

More on Hydrocarbons.  Branched Chains.

The unique features of carbon atoms: the ability to form four chemical bonds and to form chemical bonds with other carbon atoms to form long chains. In addition to long linear chains, carbon can also form compounds with branches. Once you have 4 carbons in a chain (butane)there is more than one way to arrange the carbons. The figure below shows different representations of a compound called iso-butane, an isomer of what we originally wrote for butane. (Isomers are compounds that have the same type and number of atoms but a different arrangement). The straight chain form could be called normal butane, or n-butane but, once there is a precise name for isobutane, n-butane will just be called butane.


So, the problem is that there are literally millions of compounds and you can’t have a name for every one. Besides, chemists don’t really like to memorize things and pretty much feel that learning the names of the ten straight chain hydrocarbons should be enough and there must be a logical system for naming organic compounds by relating them to the simpler ones.

The Systematic Name Game.

The system in organic (called the IUPAC system after the International Union of Pure and Applied Chemists) starts from the straight chain hydrocarbons. Every compound is named as if it were derived from one of those.  To name a compound, then, find the longest possible continuous straight chain of carbon atoms.  For isobutane, this would be 3, that is propane.  What about the extra carbon atom?  That is assumed to come from a hydrocarbon too but is considered a substituent (substituting for a hydrogen atom), that is, an “add-on” and is given an adjective name “methyl,” and so a systematic name for isobutane is methyl-propane.  Similarly, there are two isomers for the 5-carbon hydrocarbon: pentane and methyl-butane.  For the 6-carbon compounds vatiation, methyl-pentane, there are two different isomers. Using the rule from the alcohols, the two must be called 2-methyl pentane (never  4-methylpentane) and 3-methylpentane. The examples at the end of this post should allow you to learn how to play the game.  A couple of questions are included.  Answers will be in the comments and the structures in the next post.  To find out what kind of substance they represent, for the simpler ones like isobutane, you can Google them but you should have a sense of power that you can give the precise chemical name for a large number of chemicals. First, two more rules.

Hydrocarbon names and substituent names.

Substituents can have more than 1 carbon (although obviously not more than the main chain to which they are attached. Why not?)

More than one substituent gets more than one number.

If there is more than one substituent, you use the prefix di-, tri-, tetra-, penta-, hexa- and indicate all numbers, even if they fall on the same carbon.  You should be able to follow the examples and you should be able to do the questions.

External links

For more information or to reinforce what you have here: Drawing organic molecules and Organic structures sites as well as Quiz on naming organic compounds.  Also, good intro as part of heavy-duty organic text (skip parts that are complicated).

Finally, cholestane

The hydrocarbon chains (and branches) can sometimes be written, like the cyclic hydrocarbons, just showing the geometry.  Recall the 3-D convention: a wedge represents atom coming out of the screen and a dotted line, an atom behind the plane of the screen.  Here it is.  Cholestane is the basic structure.  Cholesterol is an alcohol derivative as above.

The following question was posted on Facebook:

I had thought that free fatty acids were triglycerides. But I am reading a study that measured both. Can someone enlighten me on free fatty acids? … please.

 I think I can help.  The good news is that, contrary to the college myth, organic chemistry is easy — it is freshman chemistry that is hard because it has more physics and mathematics.  Now, jumping into lipid metabolism is a little bit of starting in the middle of things but the reason organic chemistry is easy is that it has only a few assumptions and basic principles and the basic theory, at least, is logical and you can get pretty far deducing things from simple principles, so with a few basic ideas we may have a shot. I have two YouTube videos that are short, relatively easy and might be a background.  The take home message from the videos, the one big idea in organic, is that organic compounds have two parts: A hydrocarbon backbone and a non-hydrocarbon part that contains the chemically reactive part of the molecule, the functional groups. The assumption is that all compounds with the same functional group have similar chemistry.  So, for example, all carboxylic acids have the carboxyl (-COOH) functional group. In many ways, even a simple acid like acetic acid has chemical properties that are similar to a complicated acid, like the fatty acids.  You may need the YouTube to appreciate this: chemistry is about structure, that is, it is visual.

Bottom line on fatty acids and Triglycerides

All dietary and body fats and oils are triglycerides (TG) or, more correctly, triacylglycerols (TAG).  The term “acyl” (pr. A-sill) is the adjective form of acid (i.e. There are three acids).

Fats have a roughly E-shaped structure. The arms of the E are the fatty acids and there are three of them. The fatty acids provide the real fuel in fats.  The three fatty acids are attached to the compound glycerol which is the vertical stroke of the E.  The chemical bond that attaches the fatty acid  to the glycerol is called an ester bond.  You only need to know the term ester because when the fatty acids are found alone, especially in blood, they are referred to either as free fatty acids (FFA) or, because they are no longer attached to the glycerol by the ester bonds, as non-esterified fatty acids (NEFA): FFA and NEFA are the same thing.

Metabolism: the fatty acid-TAG cycle.

The digestion of fat in the intestine involves the progressive removal of the fatty acids from the first and last position of the glycerol.  The process is called lipolysis and the enzyme that catalyzes the reaction is called a lipase. What remains is called 2-monoacylglycerol, or 2-MAG  (fatty acid still attached at the center carbon of glycerol) and  2-MAG and the free fatty acids from digestion are absorbed into the intestinal cells.  Within these cells they are re-formed into TAG which is exported together with cholesterol and other components in particles called chylomicrons.  Chylomicrons, in turn, represent one type of complex structure known as lipoproteins. The lipoproteins transport lipids and some of these are familiar, e.g., LDL (low density lipoprotein), HDL. Triglycerides in the blood are carried in these particles. So this is probably the triglycerides you read about.

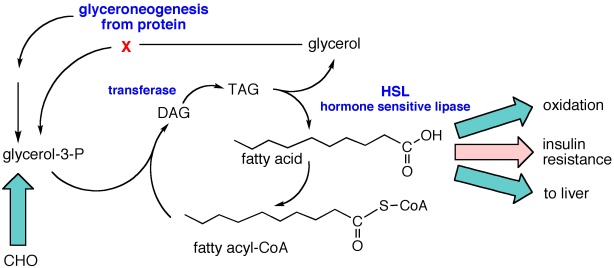
These are the transporters of lipids.  TAG, in particular is brought into cells by another lipase (lipoprotein lipase or LPL) on the cell surface that removes the fatty acids.  In other words, to be absorbed the TAG is broken down into fatty acids again.  Once absorbed, the fatty acids can be oxidized for fuel or, once again can be re-synthesized, step-wise: → MAG → diacylglycerol (DAG)  → TAG.  Here’s the summary figure:

Bottom line:

Fat (TAG) is continually broken down and re-synthesized.  The breakdown process is called lipolysis and the lipolysis-synthesis cycle goes on in different places in the body but notably in fat cells.  An interesting thing about fat cells is the way they carry out the cycle. Lipolysis is a simple process but synthesis is complicated.  Speaking in energy terms, it is easy to break down nutrients. It requires energy to put them back together.  To make TAG, either the glycerol or the fatty acid has to be “activated”: so the actual reactive form is a molecule called fatty acyl-coenzyme A or fatty acyl-CoA (pr. Co-A).

Biochemical reactions almost never run by themselves even if energetically favorable but are rather controlled by catalysts, that is, enzymes.  The enzyme that catalyzes the first step in the reaction, a transferase, will not work with glycerol itself.  The enzyme requires a particular form of glycerol, glycerol-phosphate.  The special characteristic of the fat cell is that the required glycerol-phosphate cannot be made directly from glycerol as it can, for example, in the liver which also has an active fatty acid-TAG cycle.  In order to make glycerol phosphate, fat cells require glucose. In the absence of glucose, as in starvation or a low carbohydrate diet, fat synthesis is repressed.  At the same time the enzyme that catalyzes breakdown, hormone-sensitive lipase, is enhanced because it is turned on by glucagon and turned offby insulin (these are the hormones in the term “hormone-sensitive lipase”).  This was the original rationalization for the apparent advantage in a low-carbohydrate diet: without carbohydrate the adipocyte would not be able to supply glycerol-phosphate and the fatty acid-TAG cycle would go largely in one direction: breakdown to produce fatty acids and this is undoubtedly one of the major effects.

It turns out, however, that the fat cells protect stores of energy in fat by other methods. We now understand that cells run a process called glyceroneogenesis which is a truncated form of gluconeogenesis, the process whereby glucose is synthesized from other nutrients, mostly protein, that is, the process supplies an intermediate in the synthesis of glucose and this can be converted to glycerol-phosphate. Generally, especially if the diet is hypocaloric, the net effect is to break down fat and supply fatty acids as a fuel for other cells.  Fatty acids circulate in the blood bound to a protein called albumin. Under conditions where there is higher carbohydrate, however, and the fatty acids are not being used for fuel, they can stimulate insulin resistance. So, fatty acids in the blood are a good thing if you are breaking down fat to supply energy.  They are not so good if you are over-consuming energy or carbohydrates because, in the presence of insulin, they can lead to insulin resistance.

Summary: triglycerides are made of three fatty acids.  There is a continual fatty acid-TAG cycle that goes on all the time in different cells.  Triglycerides in the blood are carried in lipoprotein particles, chylomicrons, LDL, HDL.  Fatty acids in the blood are carried by the protein albumin.

The King in Hamlet says “you cannot speak of reason to the Dane and lose your voice” and most Americans do feel good about the Danes. We hold to the stereotype that they are friendly folk with a dry sense of humor like Victor Borge.  That is why Reuben and Rose Mattus, the Polish-Jewish immigrant ice-cream makers from the Bronx who tried to find an angle that would allow them to compete with Sealtest® and other big guns, picked Häagen-Dazs® as the name for their up-scale ice cream, even including a map of Denmark on the early packaging. (Never mind that there is no Scandinavian language that has the odd-ball collection of foreign-looking spelling; Danish does not have an umlaut and I don’t think any Indo-European language has the combination “zs;” there is Zsa Zsa Gabor, of course, but Hungarian is a Uralic language related only to languages that you never heard of).

Jakob Axel Nielsen

The original post here held that the Mattuses would have been very surprised to see that products like their high-butterfat ice cream are now a target of the Danish government which instituted a tax on foods containing saturated fat on October 1 of 2011. The tax, I am happy to say has since been repealed.  In a brilliant turn-around that gives a great insight into the mind of the tax man, the Times reported that ” the tax raised $216 million in new revenue. To offset the loss of that money, the Legislature plans a small increase in income taxes and the elimination of some deductions.” Get it? They are going to increase taxes to cover the money that they hoped to have, never mind, that the intention was to stop people from buying the stuff that would bring in the revenue.

The original idea for collecting taxes on a number of items including “sugar, fat and tobacco,” came from  Jakob Axel Nielsen (right), then Sundhedsminister.  A graduate of the law school at Aarhus, Nielsen is reputed to know even more about science than Hizzona’ Michael Bloomberg.  The LA Times points out, however, that “for those who may be tempted to call for Nielsen’s job, please note that he stepped down…last year.”

One of the things that is surprising about all this is that, in  2009, a combined Danish and American research group whose senior author was Dr. Marianne Jakobsen of Copenhagen University Hospital published a paper showing that there was virtually no effect of dietary saturated fatty acids (SFAs) on cardiovascular disease.  The study was a meta-analysis which means a re-evaluation of many previous studies. The authors concluded that the results “suggest that replacing SFA intake with PUFA (polyunsaturated fatty acid) intake rather than MUFA (monounsaturated fatty acids) or carbohydrate intake prevents CHD (coronary heart disease) over a wide range of intakes.”

As in many nutritional papers, it is worthwhile to actually look at the data.  The figure below, from Jakobsen’s paper shows the results from several studies in which the effect of substituting 5 % of energy from SFA with either carbohydrate (CHO) or PUFA or MUFA (not shown here) was measured.  The outcome variable is the hazard ratio for incidence of coronary events (heart attack, sudden death).  You can think of the hazard ratio as similar to an odds ratio which is what it sounds like: the comparative odds of different possible outcomes. The basic idea is that if 10 people in a group of 100 have a heart attack with saturated fat in their diet, the odds = 10 out of 100 or 1/10.  If you now replace 5 % of energy with PUFAs for a different group of 100 and find only 8 people have an event, then the odds for the second group is 8/100 and the odds ratio is 0.8 (8/100 divided by 10/100).  If the odds ratio were 1.0, then there would be no benefit either way, no difference if you keep SFAs or replace.  So in the first figure below, most of the points are to the left of the point 1.0, suggesting that PUFA is better than SFA but the figure on the right suggests that SFA is better than CHO.  But is this real?

You probably noticed that you would have the same odds ratio if the sample sizes were 1000.  In other words, a ratio gives relative values and obscures some information. If there were a large number of people and the real numbers were actually 8 and 10, you wouldn’t put much stock in the hazard ratio; decreasing your chances of a low probability event is not a big deal; you double your chances of winning the lottery by buying two tickets.  In fact, whereas heart disease is a big killer, if you study a thousand people for 5 years there will be only a small number of coronary events. I discussed this in a previous post, but giving Jakobsen the benefit of the doubt that there were really differences on outcomes, we need to know whether the hazard ratios are really reliable.  In this case, Jakobsen showed the variability in the results with “95% confidence intervals,” which are represented by the horizontal bars in the figure.

The 95% confidence interval (95% CI) is a measure of the spread of values around the average. It tells you how reliable the data is. Technically, the term means that if you calculate the size of the interval over and over, 95% of the time the interval will contain the true value. Although not technically precise, you could think of it as meaning that there is a 95% chance of the interval containing the true value.

There is one important point here. It is a statistical rule that if the 95% CI bar crosses the line for hazard ratio = 1.0 then this is taken as indiction that there is no significant difference between the two conditions, in this case, SFAs or a replacement.  Looking at the figure from Jakobsen, we are struck by the fact that, in the list of 15 different studies for two replacements, all but one cross the hazard ratio = 1.0 line; one study found that keeping SFAs in the diet provides a lower risk than replacement with carbohydrate. For all the others it was a wash.  At this point, one has to ask why a combined value was calculated.  How could 15 studies that show nothing add up to a new piece of information. Who says two wrongs, or even 15, can’t make a right?  The remarkable thing is that some of the studies in this meta-analysis are more than 20 years old. How could these have had so little impact?  Why did we keep believing that saturated fat was bad?

Taxing Saturated Fat.

Now the main thing that taxes do is bring in money.   That’s why it is not a good idea to tie it to a health strategy unless you are really sure (as in the case of cigarettes). For one thing, there is something contradictory (or pessimistic) about trying to raise money from a behavior that you want people to stop doing.   In any case, given that during the epidemic of obesity and diabetes, saturated fat intake went down (for men, the absolute amount went down by 14%), and that there was no effect on the incidence of heart disease (although survival was better due to treatment), there is every reason to consider  the possibility of unexpected negative outcomes (think margarine and trans-fat).  Although now repealed, it is worth considering possible unintended consequences (since the sugar tax is still alive).  Suppose that the Danes had reduced consumption of saturated fat but still ate enough to bring in money. And suppose that this had the opposite effect — after all, if you believe the Jakobsen study, substituting carbohydrate for saturated fat will increase cardiovascular risk.  So now there would be a revenue stream that was associated with an increase in cardiovascular disease.  What would they have done?  What would we do? Well, we’d stop it, of course.  Yeah, right.

“The truth?  If I wanted the truth, I would have called Sixty Minutes.”

— Spiros Focás in Jewel of the Nile.

Sugar is an easy target. These days, if you say “sugar” people think of Pop-Tarts® or Twinkies®, rather than pears in red wine or tamagoyaki the traditional sweet omelet that is a staple in Bento Boxes.  Pop-Tarts® and Twinkies® are especially good targets because, in addition to sugar (or high fructose corn syrup (HFCS), they also have what is now called solid fat (the USDA thinks that “saturated” is too big a word for the average American ) and the American Heart Association and other health agencies are still down on solid fat.  Here’s a question, though: if you look on the ingredients list for Twinkies®, what is the first ingredient, the one in largest amount?  (Answer at the end of this post).

The Threat

What went wrong in the obesity epidemic?  There is some agreement that by focussing on fat, the nutritional establishment gave people license to over-consume carbohydrates. The new threat is that by focusing now on fructose, the AHA and USDA and other organizations are giving implicit license to over-consume starch — almost guaranteed since these agencies are still down on fat and protein.  The additional threat is that by creating an environment of fructophobia, the only research on fructose that will be funded are studies at high levels of total carbohydrate where, because of the close interaction between glucose and fructose, deleterious effects are sure to be found. The results will be generalized to all conditions.  Like lipophobia, there will be no null hypothesis.

The latest attack on sugar and on fructose itself (sugar and HFCS are half fructose) comes from Robert Lustig, a pediatrician at University of California San Francisco. His lecture describing fructose as a virtual poison got more than a million and a half hits on YouTube.  The presentation has an eponymous style (Lustig, Ger. adj., merry, amusing, e.g. Die Lustige Witwe, The Merry Widow) and includes a discussion of the science bearing on fructose metabolism. While admitting the limitations of that science, even Gary Taubes was worried. Comments on YouTube and other sites say they liked the science but did not agree with his recommendations — it will turn out that he now wants government control of sugar consumption, especially for my kid and yours.

The presentation of the science is compelling but, while it has a number of important points, it is clearly biased and, oddly, a good deal of it is totally wrong, some of it containing elementary errors in chemistry that border on the bizarre — how hard would it have been to open an elementary organic chemistry text?  In trying to draw parallels between alcohol and fructose, Lustig says “ethanol is a carbohydrate.” Ethanol is not a carbohydrate.  A horse is not a dog. If you said that ethanol is a carbohydrate in sophomore Organic Chemistry, you would get it wrong. Period. No partial credit. Such elementary errors compromise the message and raise the question in what way Lustig is an expert in this field.  It gets worse.

It is biological function that is important and ethanol is not processed like fructose as Lustig says. There is very little chemical sense in saying that ethanol and fructose are processed biologically in similar ways.  And a metabolic pathway is shown in which glycogen is absent. Glycogen is the storage form of glucose and is generally taken as a good thing because of its relation to endurance in athletes but, like fat, glycogen is a storage form of energy and having a lot is not always a good thing.  In any case, it is not true that fructose does not give rise to glycogen.  In fact, fructose is generally better at forming glycogen than glucose is.  This is especially true when you consider the effect of exercise which is why Gatorade® may actually be a good thing if you are in a football game rather than watching one. This is the general error in Lustig’s talk.  Metabolism is not static and has evolved to deal with changing conditions of diet and environment. A metabolic chart, like any map only tells you where you can go, not whether you go there. And the notable absence in Lustig’s talk is data.

It is possible that  sugar and ethanol have behavioral effects  in common but this is not due to similarities in metabolism.  And even the behavioral effects are not settled within the psychology community; alcoholism is far different from “sugar addiction,” if there is such a thing; polishing off the whole container of Häagen-Dazs® may not technically qualify as addictive behavior.

The Threat of Policy

All of this might be okay — Lustig’s lecture was not a scientific treatise — except that he has gone to the next step.  Convinced of the correctness of his analysis, he wants government intervention to control sugar and sweeteners in some way .  There is an obvious sense of deja-vu as another expert attempts to use the American population as Guinea pigs for a massive population experiment, like the low fat fiasco under which we still suffer. It is not just that we got unintended consequences (think margarine and trans-fats) but rather that numerous people have pointed out that the science was never there for low-fat to begin with (brilliantly explained in Fat Head).  In other words leaving aside the question of when we should turn science into policy, is the science any good?

Fructose

It is important to understand that fructose is not a toxin. It is a normal metabolite. If nothing else, your body makes a certain amount of fructose.  Fructose, not music (the food of love), is the preferred fuel of sperm cells. Fructose formed in the eye can be a risk but its cause is generally very high glucose. Fructose is a carbohydrate and is metabolized in ways similar to, if different in detail, from glucose but a substantial amount (can be 60 %) of fructose is turned to glucose — that is why the glycemic index of fructose is 20 and not zero.

The extent to which fructose metabolism has a uniquely detrimental effect is strongly dependent on conditions.  Fructose may be worse than glucose under conditions of very high carbohydrate intake but its effect will change as total carbohydrate is lowered. And since carbohydrate across the board is what is understood to be the problem — Lustig states that clearly in his YouTube — policy would suggest that that is the first line of attack on health — reduce carbohydrate (emphasizing fructose if you like) but as carbohydrate and calories are reduced, any effect of fructose will be minimized.  In the extreme, if you are on a very low carbohydrate diet, any fructose you do eat is likely to be turned into glucose.

The Opportunity

Lustig makes his case against fructose in terms of fundamental biochemistry which is really how it should be.  Can biochemistry be explained to the general population?  Can the problem be explained in a simple but precise way so that we really have the sense of talking about science and not politics?  So what is needed is somebody who actually knows biochemistry.  Maybe somebody with experience in teaching biochemistry to future doctors.  Hey, that’s my job description.  In fact, I’m going to try that in the next few blogs and on YouTube. I and others have  taught courses that try to reduce the three year sequence that professional chemists follow: general chemistry-organic chemistry-biochemistry.  I will try to give everybody a window into organic chemistry, biochemistry and metabolism. In fact, that might be a good focus for government intervention. Instead of punishing the patient, how about funding for teaching biochemistry to the public. For the moment, though, let’s look at some population data.

Sweetener Consumption.

What about sweeteners?  Well, of course, consumption has gone up. Surprisingly, not as much as one would have thought.  According to the USDA about 15 %.  One question is whether this increase is disproportionately due to fructose. The figures below show that, in fact, the ratio of fructose to glucose has remained constant over the last 40 years.  (The deviation from 1:1 which would be expected for pure sucrose or HFCSA, is due to a  relatively constant 20 % or so of pure glucose that  is used in sweetening in the food industry). It is possible that, although the ratio is the same, that the absolute increase in  fructose has a worse effect than the increased glucose but, of course, you would have to prove it.  The figures suggest, however, that you will have to be careful in determining whether the effect of increased sweetener is due to fructose or glucose, or the effect of one on the other, or the effect of insulin and other hormones on both.  An unrestrained, lustige, lack of anything careful is exactly the current threat.

Answer to “puzzler:” The main ingredient in Pop-Tarts® and Twinkies® is flour. Some people say that if you add up the different forms of sugar that will be greater but like all ideas derived from Lustig, there is an advantage in looking at the data: 38 g. of carbohydrate, 17 g. of sugars.